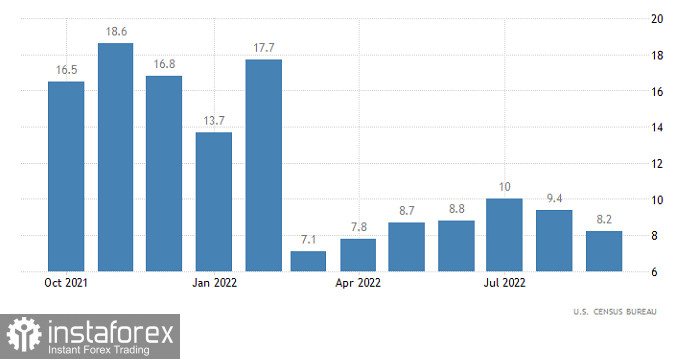
The US retail sales figures failed to meet the forecast. Firstly, the previous data was upwardly revised to 9.4% from 9.1%. Secondly, in the given period, the retail sales growth slackened to 8.2% instead of 8.0%. Although the data is well above the forecast, consumer activity, which is the main driver of the US economy, is still falling.
US Retail Sales

However, the data from the US had zero effect as earlier it became known that UK Prime Minister Liz Truss fired Chancellor of the Exchequer Kwasi Kwarteng. The pound sterling started rapidly losing value. The fact is that Kwasi Kwarteng took the post just 39 days ago. The current situation points to the aggravating political crisis in the UK. What is more, today, the UK is going to hold trust in the government poll. The thing is that Liz Truss has every chance to leave the post. She may set a record as a prime minister that served less than two months. In light of aggravating economic and energy crises, such frequent government changes will hardly add optimism to the current situation and improve the existing economic condition of the country. The effect is the opposite. It means that the British pound will remain under pressure.
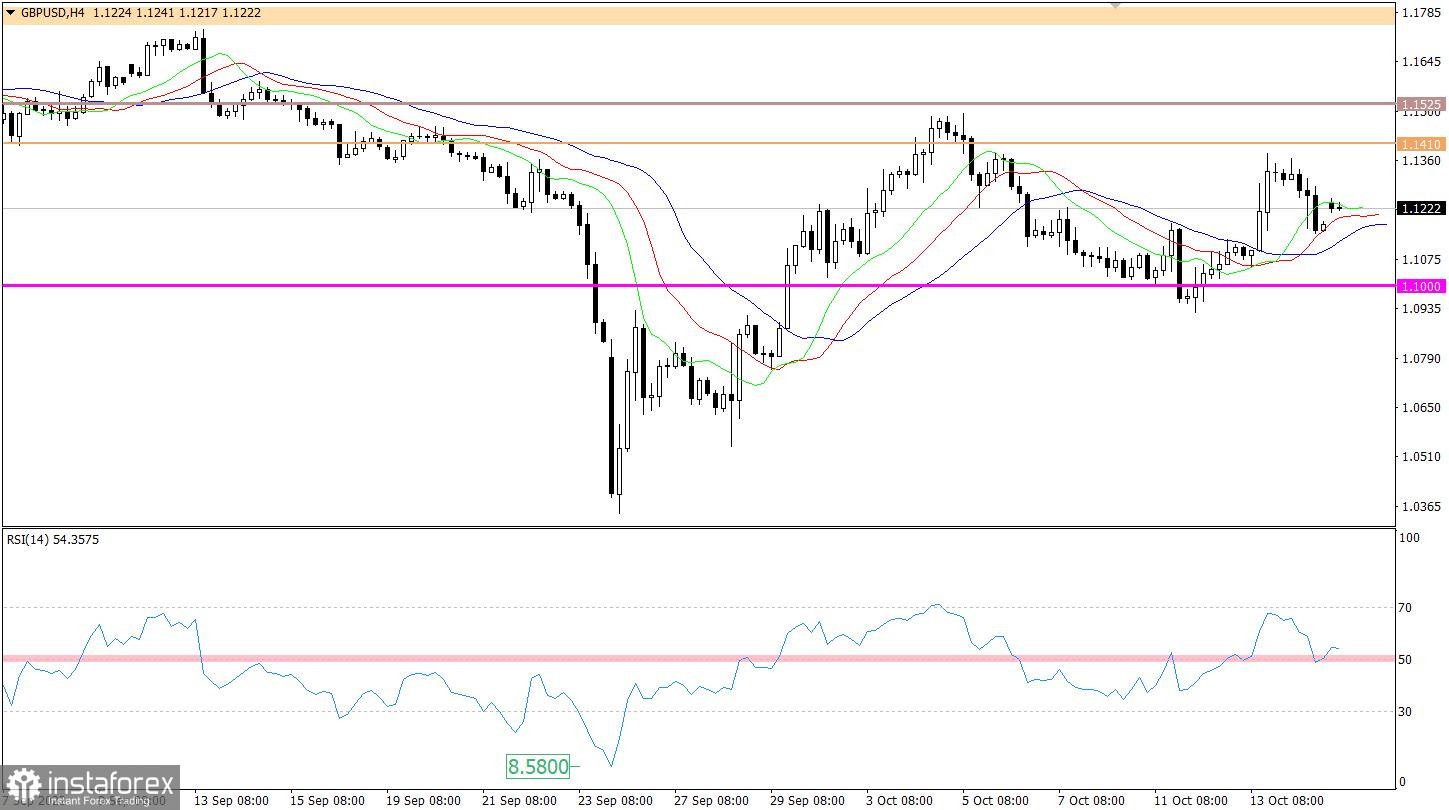
The pound/dollar pair hit the lower limit of the resistance area of 1.140/1.1525 amid the upward impulse. As a result, the volume of short positions dropped, thus causing a slowdown and a rebound.
On the four-hour chart, the RSI technical indicator returned to level 50, whereas, on the daily chart, it managed to settle above the moving average.
On the four-hour chart, the Alligator's MAs have numerous intersections with each other. This points to the mixed market sentiment. On the daily chart, the indicator ignores all price fluctuations. MAs are headed downward.
Outlook
The pound/dollar pair opened a new trading week with a rise of 50 pips. To resume falling, the price should drop by 50 pips and settle below 1.1150. In this case, it will have every chance to slide to 1.1000.
The upward scenario will become possible if the price returns to the resistance area of 1.1410/1.1525.
Regarding the complex indicator analysis, we see that in the short-term and intraday periods, indicators provide downward signals amid the price's bounce off the resistance area.


