


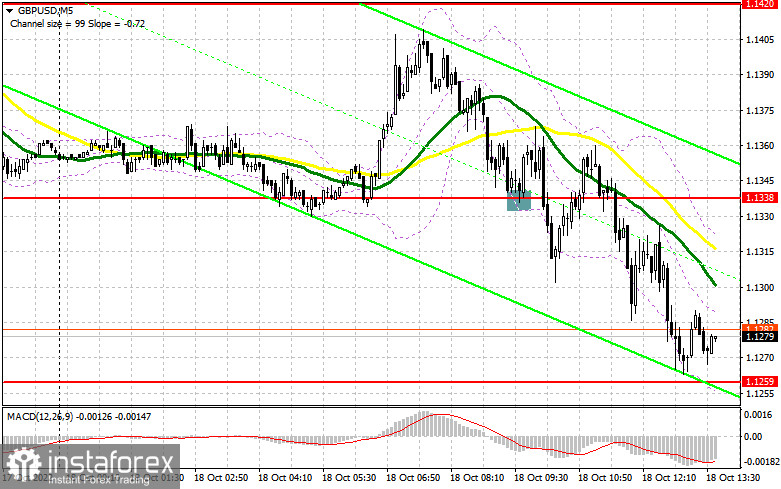
In the morning article, I turned your attention to the level of 1.1338 and recommended making decisions with this level in focus. Now, let's look at the 5-minute chart and try to figure out what actually happened. A decline and false breakout of this level gave an excellent buy signal. However, buyers hastily left the market. So, a rise ended before it actually started. The pair grew by 20 pips. After that, it returned to 1.1338. So, it was clear that further upward movement was unlikely. A breakout and an upward test of this level took place. However, it was difficult to make a decision to sell there as it was risky to open positions at the 1.1338 level. In the afternoon, the technical outlook was completely revised.
Conditions for opening long positions on GBP/USD:
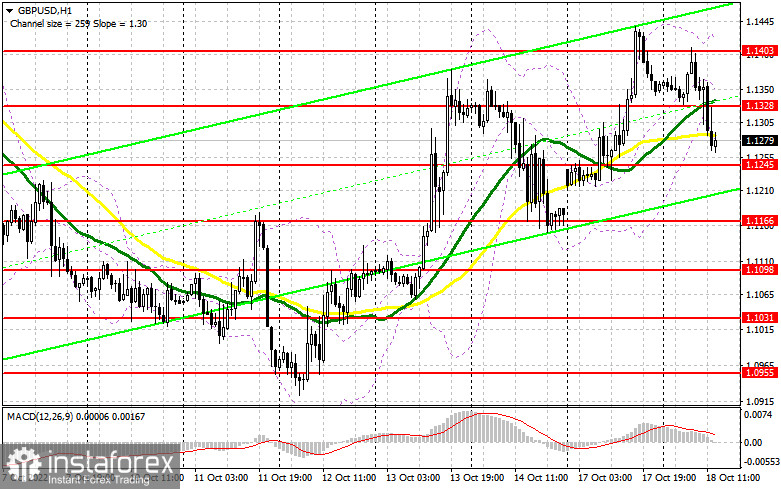
The US is going to unveil industrial production data today. This report will hardly significantly affect the pound sterling. If the pair declines further and the pressure on the pound sterling remains high, only a false breakout of the support level of 1.1245, similar to the one I have discussed above, will provide a buy signal. If so, the pair is likely to maintain its upward movement. The lower border of the uptrend channel is located below 1.1245. You should pay great attention to this level. The target level will be 1.1328. The moving averages, which are passing in negative territory, are located below this level. A breakout and a downward test of 1.1328 will open the path to 1.1403. It might help bulls take the upper hand. If the pair rises above the indicated level, it could try to break 1.1488 where I recommend locking in profits. If GBP/USD drops amid strong economic reports and bulls show no activity at 1.1245, the pressure on the pound sterling will increase. In this case, it is better to postpone long positions until a false breakout of 1.1166 takes place. You can buy GBP/USD immediately at a bounce from 1.1098 or 1.1031, keeping in mind an upward intraday correction of 30-35 pips.
Conditions for opening long positions on GBP/USD:
The bears have done everything possible to regain control of the market. It looks like they are about to succeed. It is recommended to open short positions after a false breakout of the resistance level of 1.1328. It will allow traders to build the upper border of the new downtrend channel. The target level will be the nearest support level of 1.1245. Only a breakout and an upward test will give a good sell signal at a low of 1.1166. Buyers are now trying to regain control of this level. A more distant target will be the 1.1098 level where I recommend locking in profits. If GBP/USD rises and bears show no energy at 1.1328 during the American session, the bulls will return to the market, trying to push the pair to the monthly highs. The pair may approach 1.1403. Only a false breakout of this level will provide a sell signal for short positions with the prospect of a further decline. If there is no fight for the level, you can sell GBP/USD immediately at a bounce from 1.1488, keeping in mind a downward intraday correction of 30-35 pips.
COT report
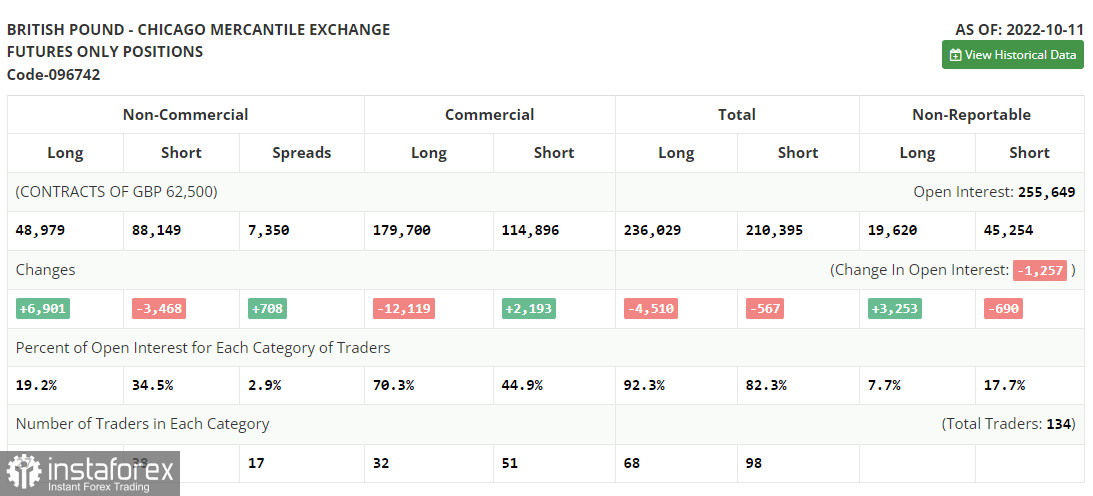
The COT report (Commitment of Traders) for October 11 logged a sharp decline in short positions and an increase in long ones. The intervention of the Bank of England has bolstered bullish momentum. Now, many traders are expecting a further increase in the pound sterling in the medium term. Recently, the BoE has decided to temporarily suspend its quantitative tightening program, also known as QT, to facilitate the recovery of the bond market after the sharp collapse. Bonds plunged due to the actions of British Prime Minister Lisa Truss. However, a sharp rise in the pound sterling in the medium term looks unlikely as the UK economy may slide into a recession and aggressive tightening by the Federal Reserve System will make the US dollar more attractive. The latest COT report revealed that the number of long non-commercial positions increased by 6,901 to 48,979, while the number of short non-commercial positions dropped by 3,468 to 88,149. It led to a slight decrease in the negative delta of the non-commercial net position to -39,170 versus -49,539. The weekly closing price declined to 1.1036 against 1.1494.
Signals of technical indicators
Moving averages
GBP/USD is trading below 30- and 50-period moving averages, signaling renewed bearish pressure on the pound sterling.
Remark. The author is analyzing the period and prices of moving averages on the 1-hour chart. So, it differs from the common definition of classic daily moving averages on the daily chart.
Bollinger Bands
If GBP/USD rises, the indicator's upper border at 1.1400 will act as resistance.
Definitions of technical indicators
- Moving average recognizes an ongoing trend through leveling out volatility and market noise. A 50-period moving average is plotted in yellow on the chart.
- Moving average identifies an ongoing trend through leveling out volatility and market noise. A 30-period moving average is displayed as the green line.
- MACD indicator represents a relationship between two moving averages that is a ratio of Moving Average Convergence/Divergence. The MACD is calculated by subtracting the 26-period Exponential Moving Average (EMA) from the 12-period EMA. A 9-day EMA of the MACD called the "signal line".
- Bollinger Bands is a momentum indicator. The upper and lower bands are typically 2 standard deviations +/- from a 20-day simple moving average.
- Non-commercial traders - speculators such as retail traders, hedge funds, and large institutions who use the futures market for speculative purposes and meet certain requirements.
- Non-commercial long positions represent the total long open position of non-commercial traders.
- Non-commercial short positions represent the total short open position of non-commercial traders.
- The overall non-commercial net position balance is the difference between the short and long positions of non-commercial traders.


