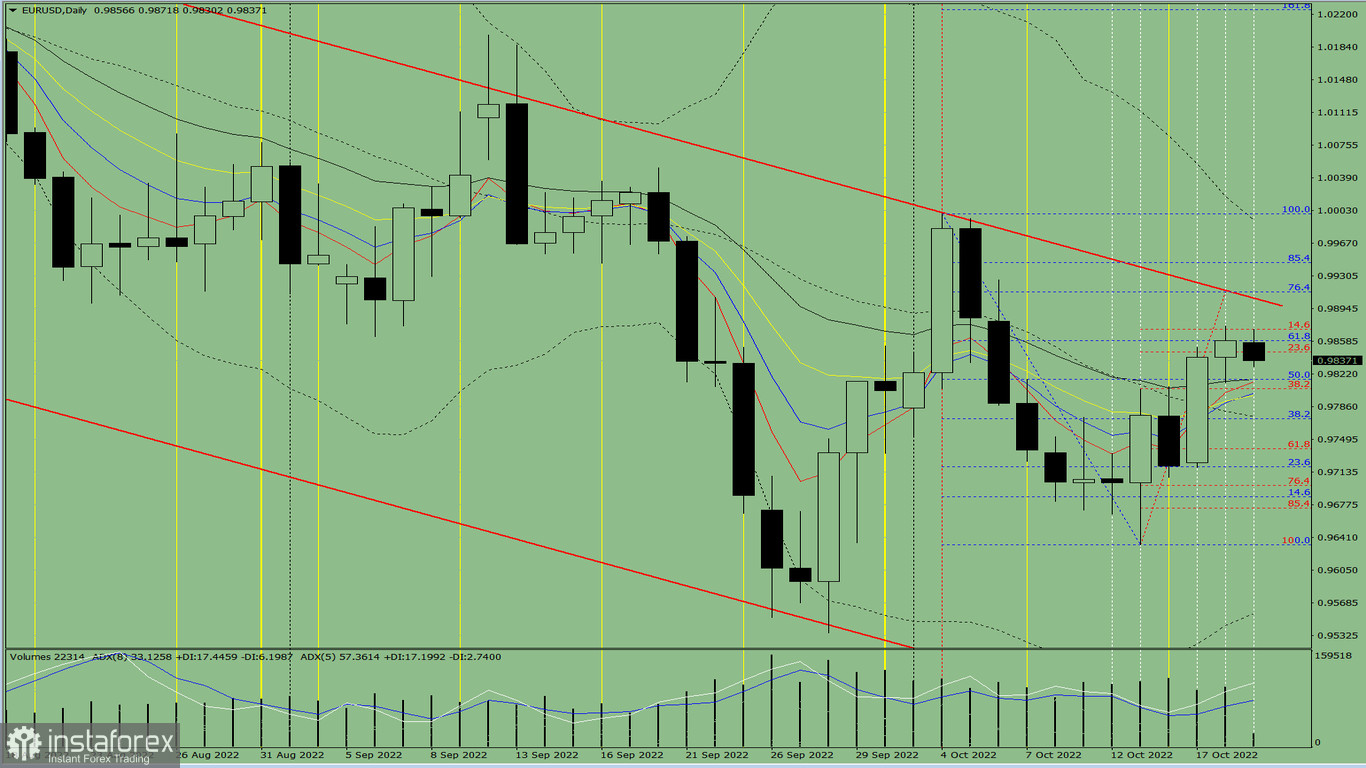
Trend analysis (Fig. 1).
On Wednesday, the price may fall from the 0.9859 mark (close of yesterday's daily candlestick) to the 38.2% retracement level of 0.9806 (red dotted line). It may then tests the level and rise to 0.9907 resistance (red bold line). If the quote tests the barrier, the downward movement will extend.

Fig. 1 (daily chart).
Complex analysis:
- indicator analysis - down
- Fibonacci levels - down
- volumes - down
- candlestick analysis - up
- trend analysis - up
- Bollinger bands - up
- weekly chart - up
Final thoughts:
Today, the price may fall from the 0.9859 mark (close of yesterday's daily candlestick) to the 38.2% retracement level of 0.9806 (red dotted line). It may then tests the level and rise to 0.9907 resistance (red bold line). If the quote tests the barrier, the downward movement will extend.
Alternative scenario: the price may fall from the 0.9859 mark (close of yesterday's daily candlestick) to 0.9816, in line with the 21-day EMA (black thin line). If the pair tests this line, it may then go up and test the 76.4% retracement level of 0.9913 (blue dotted line).


