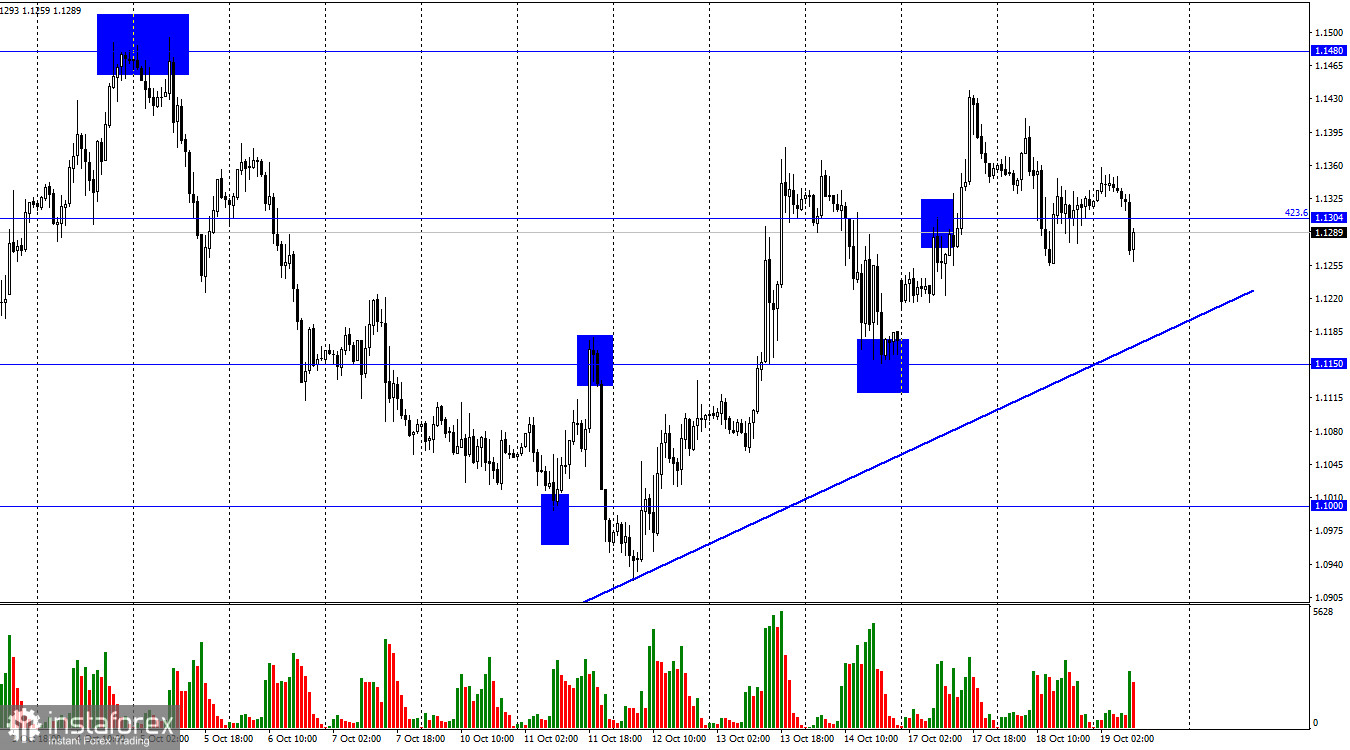
Hi everyone! On the 1H chart, the GBP/USD pair declined to 1.1304, the Fibonacci correction level of 423.6%. Today, the quotes dropped the ascending trend line. If the pair tumbles below this line, it may approach the levels of 1.1150 and 1.1000.
Despite a buoyant rally of the pound sterling for some time, its further rise looks unlikely. Today, the US revealed a fresh inflation report, which showed an acceleration to 10.1% in annual terms. A month earlier, inflation dropped to 9.9% from 10.1%. It appears that a slowdown was short-lived. On top of that, monetary tightening has been ineffective. It is rather bearish for the pound sterling.
There are rumors that the ECB might not be able to raise the key rate above 3%. As a result, it will hardly push inflation to the target level. Analysts wonder whether the Bank of England could hike the interest rate five or six more times. So far, inflation has not slowed down even after seven rate increases. The question is how many rate hikes the BoE should undertake to curb soaring consumer prices. Besides, in this case, the regulator should at least slow down inflation. It is too early to talk about a decline to the 2% target. At the same time, the pound sterling is sure to take advantage of new rate hikes. However, the Fed also sticks to a hawkish stance. It raises rates more aggressively. Now, analysts are confident that the Fed will keep hiking rates until inflation returns to the target level. The BoE will hardly be able to do the same. The UK economy is projected to slide into a recession. If some of Liz Truss's tax-cutting policies are implemented, it could lead to a budget deficit. The pound sterling is now facing a cornucopia of bearish factors - recession, budget deficit, weak pound sterling, Brexit and pandemic woes, galloping inflation, and high energy prices. This is why it is unlikely to begin a steady rally.

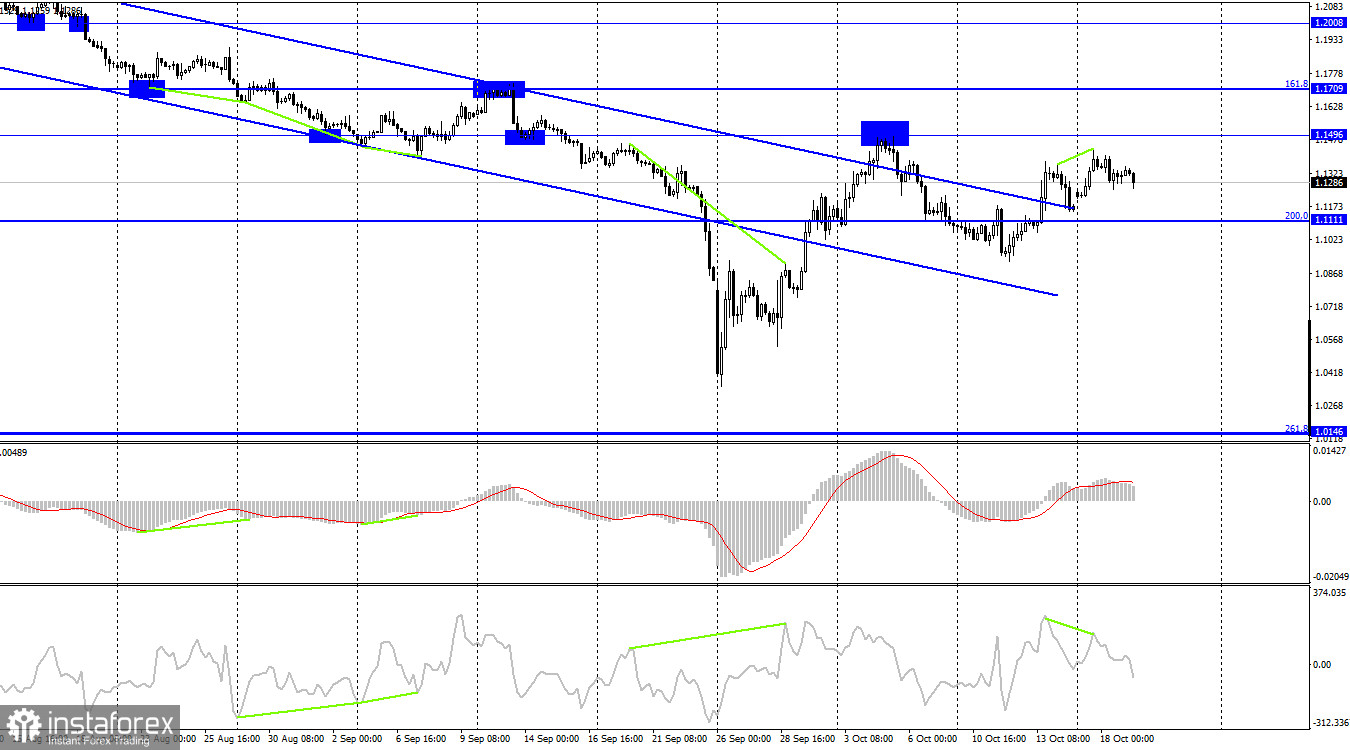
On the 4H chart, the pair closed above the downtrend corridor. This is the second consolidation, which significantly increases the probability of a rise to at least 1.1496. Nevertheless, the pound sterling had to retreat to 1.1111, the Fibonacci level of 200.0% due to the bearish divergence of the CCI indicator. Technical indicators on the 4-hour chart do not provide clear signals about the future trajectory of the pound sterling.
Commitments of Traders (COT):

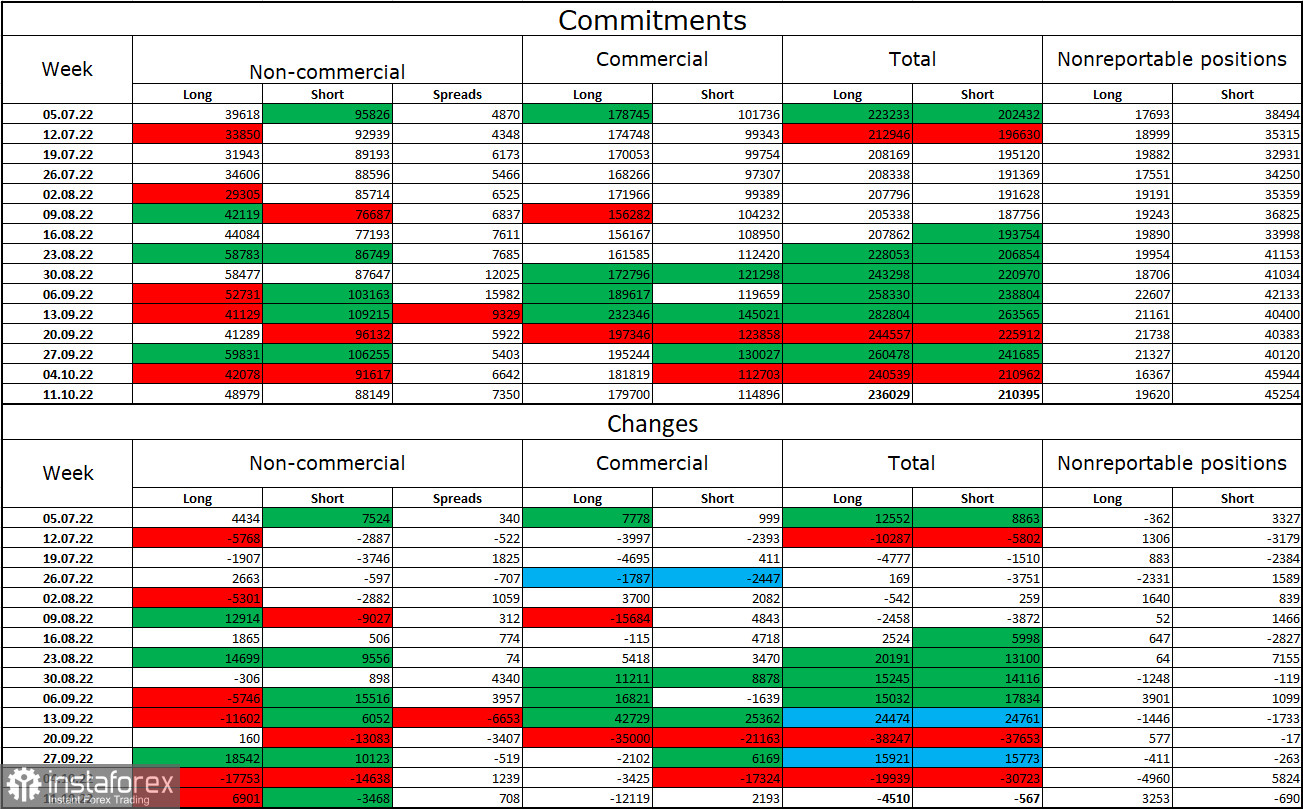
Over the past week, the non-commercial group of traders became less bearish than the week earlier. Investors opened 6,901 new long positions and closed 3,468 short ones. However, the overall sentiment of large traders remains bearish as short positions still exceed the long ones. Therefore, investors are more prone to sell the pound sterling even though their sentiment has been slowly changing towards bullish in recent months. However, this is a slow and lengthy process. The pound sterling may continue its uptrend only if supported by strong fundamental data which has not been so favorable lately. I would like to point out that although the sentiment of the euro trades has become bullish, the euro is still depreciating against the US dollar. As for the pound, even COT reports do not favor buying the pair.
Economic calendar for US and UK:
UK- CPI (06:00 UTC).
US – Building permits (12:30 UTC).
US – Fed Beige Book (18:00 UTC).
Today, the UK unveiled its inflation report. The US is going to publish macro stats as well. However, traders will pay zero attention to them. The impact of fundamental factors on market sentiment will be quite weak.
Outlook for GBP/USD and trading recommendations:
I recommended opening short positions on the pair at the target level of 1.1150 if it dropped below 1.1306. This assumption was correct. It would be wise to open new short positions if the price declines below the trend line on the 1H chart with target levels of 1.1000 and 1.0727. Investors may go long if the price rises from the trend line on the 1H chart with the target level of 1.1480.


