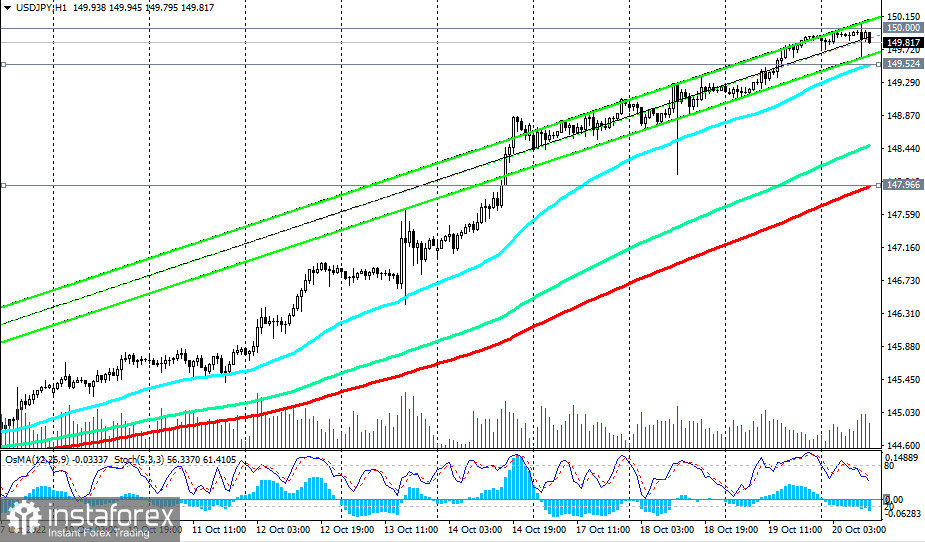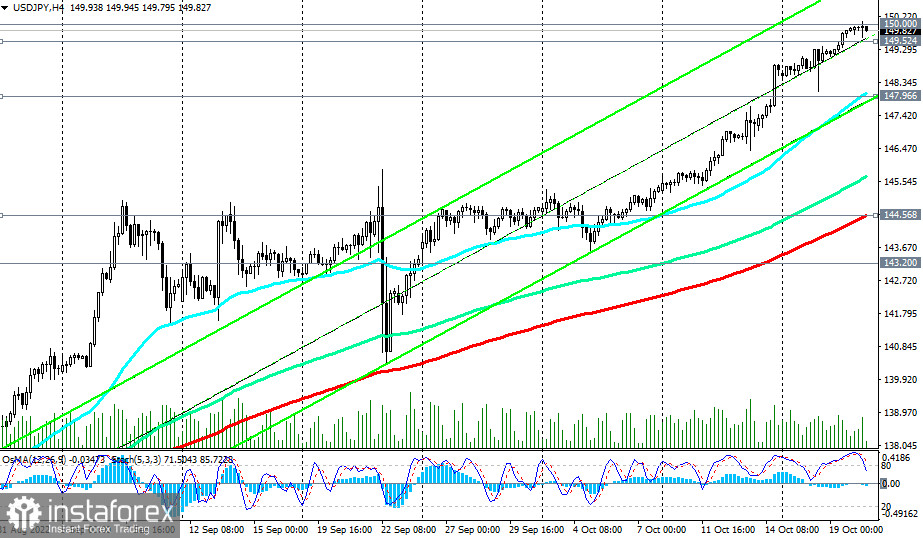
At the beginning of today's European trading session, the USD/JPY briefly topped 150.00 before dropping sharply (to 149.62). The pending orders of a certain part of the traders, who are waiting for intervention from the Bank of Japan, obviously worked.
However, the Bank of Japan is in a difficult position, given the weak pressure from low inflation, and is taking a "wait and see attitude." In general, despite fears about a new possible foreign exchange intervention by the Bank of Japan, which the bank does not warn about, the USD/JPY pair maintains a positive trend.

Most likely, and soon we will see a retest of 150.00 and further growth. Strong bullish momentum based on fundamental factors is pushing it to new all-time highs.
The main factor here remains the Fed's monetary policy, the most stringent (at the moment) in comparison with other major world central banks.
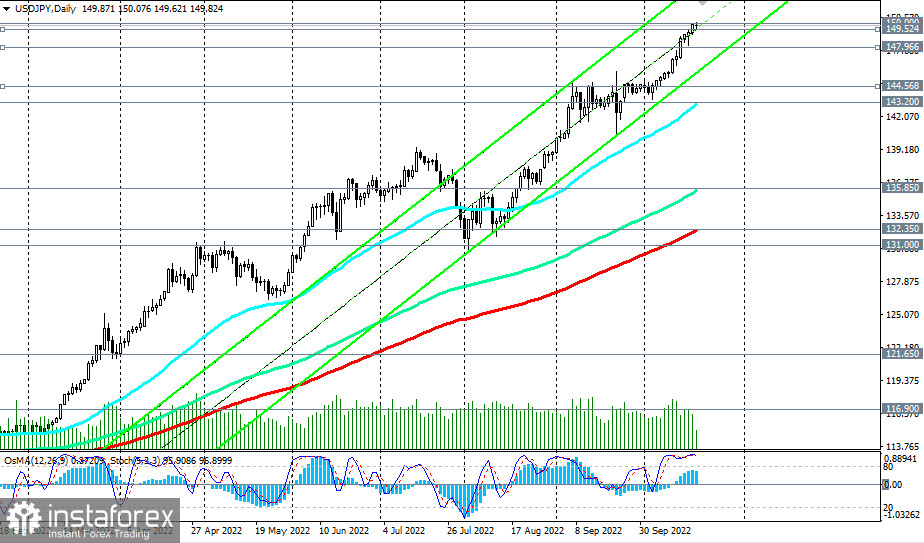
As we noted in one of our previous reviews, the divergence in the monetary policy rates of the Fed and the Bank of Japan is likely to increase, creating prerequisites for further growth of USD/JPY. In this case, the pair will move towards multi-year highs near 140.00, reached in June 1998, and possibly higher, towards multi-year highs near 147.00, reached in August 1998.

Thus, our previous forecast was fully justified, and the set targets (Buy Stop 125.50. Stop Loss 124.40. Take-Profit 125.65, 126.00, 127.00, 128.00, 134.00, 135.00) were achieved. Moreover, the price rewrote the multi-year high of 150.00 today, reaching a new local high of 150.07.
At the moment, USD/JPY is trading near the 149.80 mark, maintaining the potential for further growth.
In an alternative scenario, a breakdown of the support level 149.52 will be a signal for short-term sales. In this case, the downward correction may continue to the support level 147.97 (200 EMA on the 1-hour chart), and in case of its breakdown, to the support levels 144.38 (200 EMA on the 4-hour chart), 143.20 (50 EMA on the daily chart), where you can set new pending buy orders. A deeper decline is unlikely.
Support levels: 149.52, 147.97, 144.39, 143.20, 135.85, 132.35
Resistance levels: 150.00, 151.00, 152.00
Trading Tips
Buy Stop 150.10. Stop Loss 149.45. Take-Profit 151.00, 152.00, 153.00
Sell Stop 149.45. Stop Loss 150.10. Take-Profit 147.97, 144.39, 143.20, 135.85, 132.35


