EUR/USD 5M

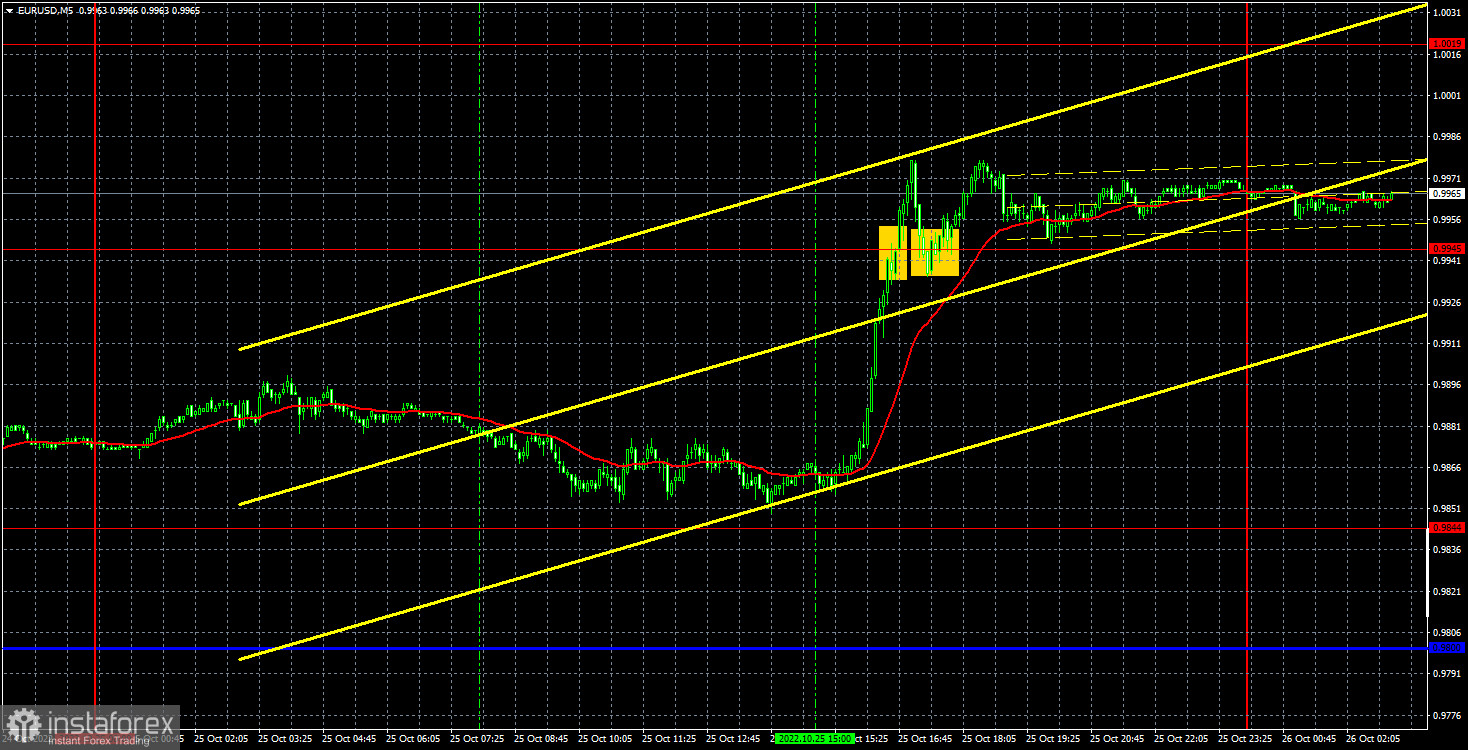
The euro/dollar pair alternated between an absolute flat and a strong trend on Tuesday. Recall that at this time the pair's movements are confusing so any development of events should be expected. However, yesterday everything went more or less logically, as the pair was again virtually in the same place during the European trading session, and again traded in a very volatile manner during the US session. There were no reports or events in the European Union and the United States that could provoke a fall in the dollar by 100 points in just an hour. Thus, we are inclined to believe that the nature of this movement was technical. The euro in the long term continues to move away from its 20-year lows, but it is still somehow hesitant. Yesterday's growth could be associated with the future European Central Bank meeting, the results of which will be known on Thursday, but at the same time, the British pound was also growing, which, in theory, should not be reacting to such a factor. But it's good that the euro is at least trying to show growth.
There was a difficult situation in regards to Tuesday's trading signals, since the very first one formed in the middle of the US session, when most of the upward movement had already been completed. Thus, after the pair grew by 100 points, it was hardly worth trying to work out a buy signal. The same applies to the second signal to buy near the level of 0.9945, it also formed too late in time. Unfortunately, a pretty good move was missed, but out of 8-10 hours of the daytime, the pair was only following a trend movement for an hour, and it was impossible to predict this breakthrough.
COT report:

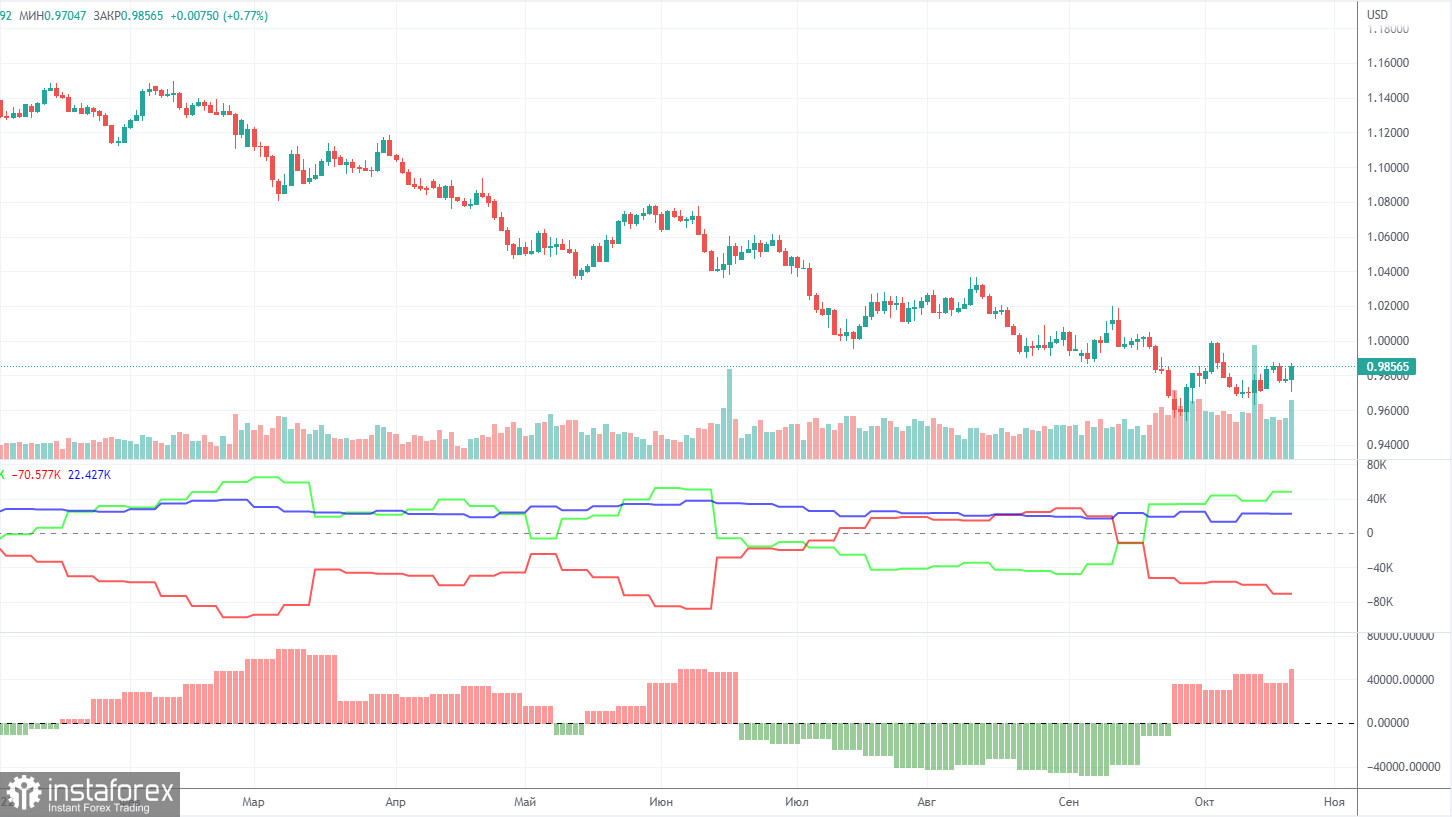
The euro Commitment of Traders (COT) reports for 2022 could be used as good examples. In the first part of the year, the reports were pointing to the bullish sentiment among professional traders. However, the euro was confidently losing value. Then, for several months, reports were reflecting bearish sentiment and the euro was also falling. Now, the net position of non-commercial traders is bullish again and the euro is still dropping. This could be explained by the high demand for the US dollar amid the difficult geopolitical situation in the world. Even if demand for the euro is rising, high demand for the greenback prevents the euro from growing. In the given period, the number of long non-commercial positions increased by 6,500, while the number of shorts decreased by 4,000. Accordingly, the net position increased by about 10,500. This fact is not of particular importance, since the euro still remains "at the bottom". At this time, commercial traders still prefer the euro to the dollar. The number of longs is higher than the number of shorts for non-commercial traders by 48,000, but the euro cannot derive any dividends from this. Thus, the net position of the non-commercial group can continue to grow further, this does not change anything. If you look at the total open longs and shorts for all categories of traders, then shorts are 22,000 more (586,000 vs 564,000). Thus, according to this indicator, everything is logical.
We recommend to familiarize yourself with:
Overview of the EUR/USD pair. October 26. Four more explosions occurred in the area of the Nord Stream pipelines.
Overview of the GBP/USD pair. October 26. The British prime ministerial election ended dull and prosaic.
Forecast and trading signals for GBP/USD on October 26. Detailed analysis of the movement of the pair and trading transactions.
EUR/USD 1H

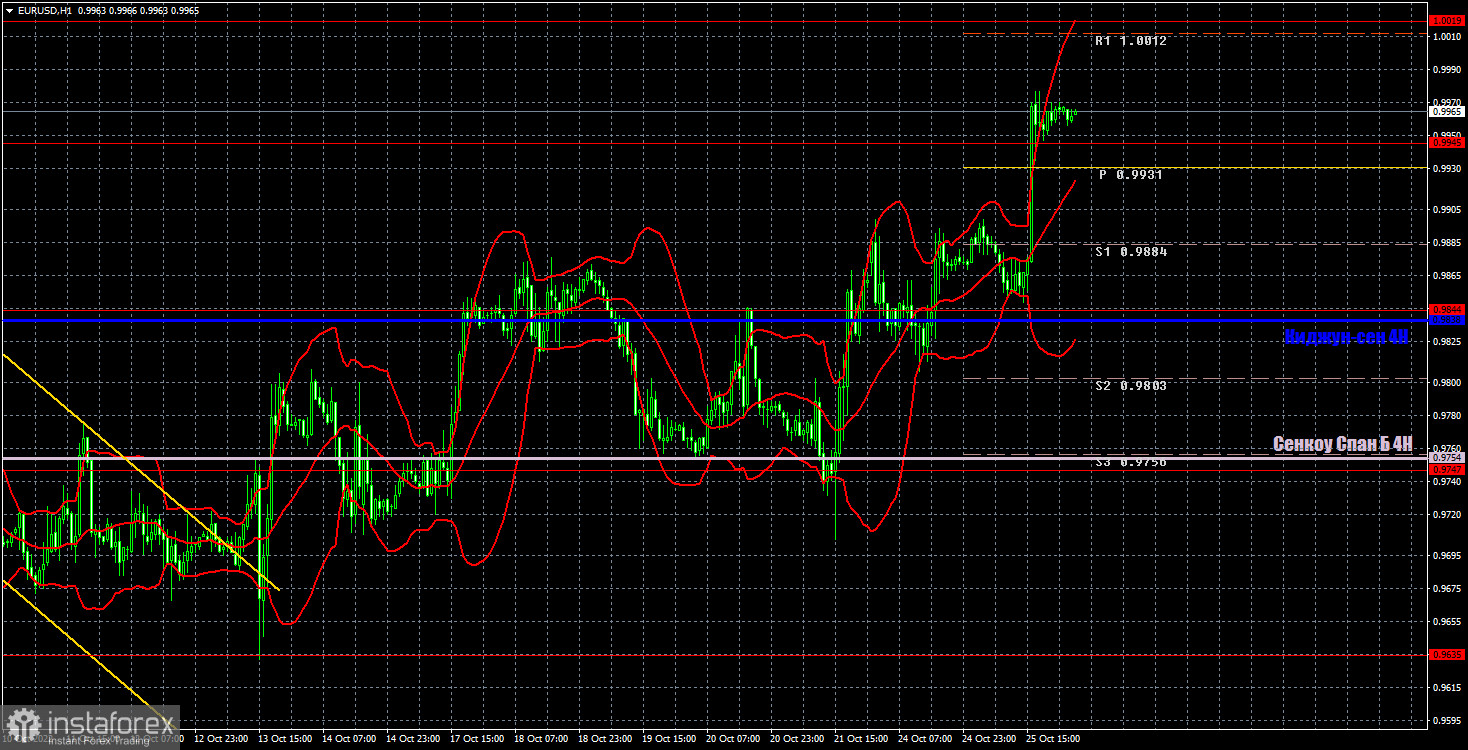
You can see on the hourly timeframe that the pair continues to form a new upward trend and, if not for yesterday's strong growth that lasted for about an hour, we would say that the pair is preparing for a new fall. But no, it came close to price parity, breaking 400 points off its 20-year lows for the second time in recent weeks. There are still no obvious reasons to buy the euro. They can be highly technical and expressed by the bears' lack of desire to continue selling the euro. On Wednesday, trading could be performed at the following levels: 0.9553, 0.9635, 0.9747, 0.9844, 0.9945, 1.0019, 1.0072, 1.0124, as well as Senkou Span B (0.9754) and Kijun-sen lines (0.9838). Ichimoku indicator lines can move during the day, which should be taken into account when determining trading signals. There are also additional support and resistance levels, but trading signals are not formed near them. Bounces and breakouts of the extreme levels and lines could act as signals. Don't forget about stop-loss orders, if the price covers 15 pips in the right direction. This will prevent you from losses in case of a false signal. Today there will be no important events or reports scheduled again in the European Union and America. Thus, once again there is a possibility that we might witness a flat or "swing".
What we see on the trading charts:
Price levels of support and resistance are thick red lines, near which the movement may end. They do not provide trading signals.
The Kijun-sen and Senkou Span B lines are the lines of the Ichimoku indicator, moved to the one-hour chart from the 4-hour one. They are strong lines.
Extreme levels are thin red lines from which the price bounced earlier. They provide trading signals.
Yellow lines are trend lines, trend channels, and any other technical patterns.
Indicator 1 on the COT charts reflects the net position size of each category of traders.
Indicator 2 on the COT charts reflects the net position size for the non-commercial group.


