


Analysis of Friday's deals:
30M chart of the EUR/USD pair
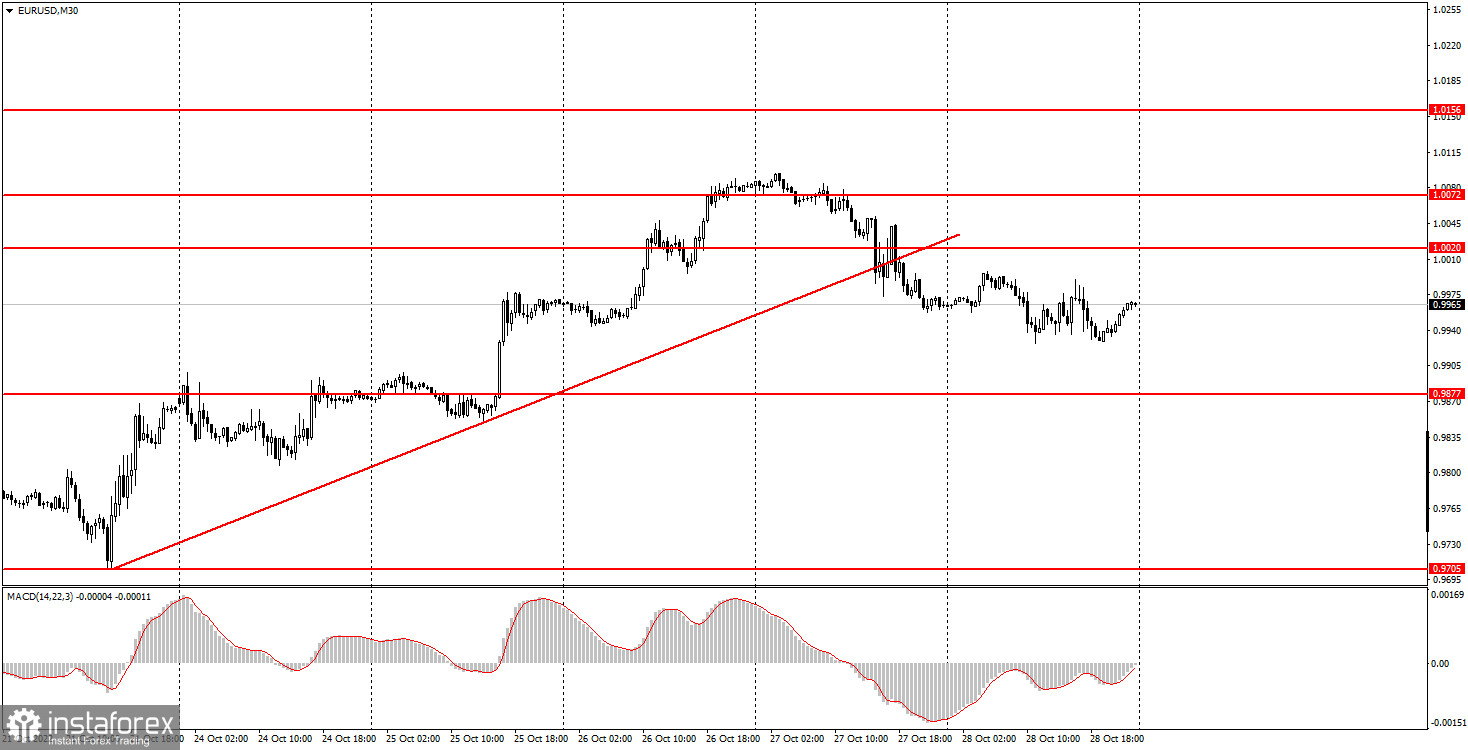
The EUR/USD currency pair did not show anything interesting on Friday. After the market "digested" the results of the European Central Bank meeting on Thursday, there was no more strength left for Friday and the pair was in a fairly calm movement all day, as close as possible to a flat. Important macroeconomic statistics were not planned for this day either in the US or in the EU, but even those reports, which were, turned out to be as neutral as possible. That is, their actual values almost coincided with the forecasts. For example, personal income and spending of the American population grew by 0.4% and 0.6%, while forecasts were 0.3% and 0.4%. However, the pair still settled below the ascending trend line on Thursday, so at this time, a downward movement is more likely. We believe that the market fully worked out the ECB rate hike last week, but now the Federal Reserve meeting is ahead, which will also raise its key rate, therefore, following the market logic, the US dollar should rise next week. However, the market often interprets the results of central bank meetings in its own way, so you cannot be 100% certain of a downward movement.
5M chart of the EUR/USD pair
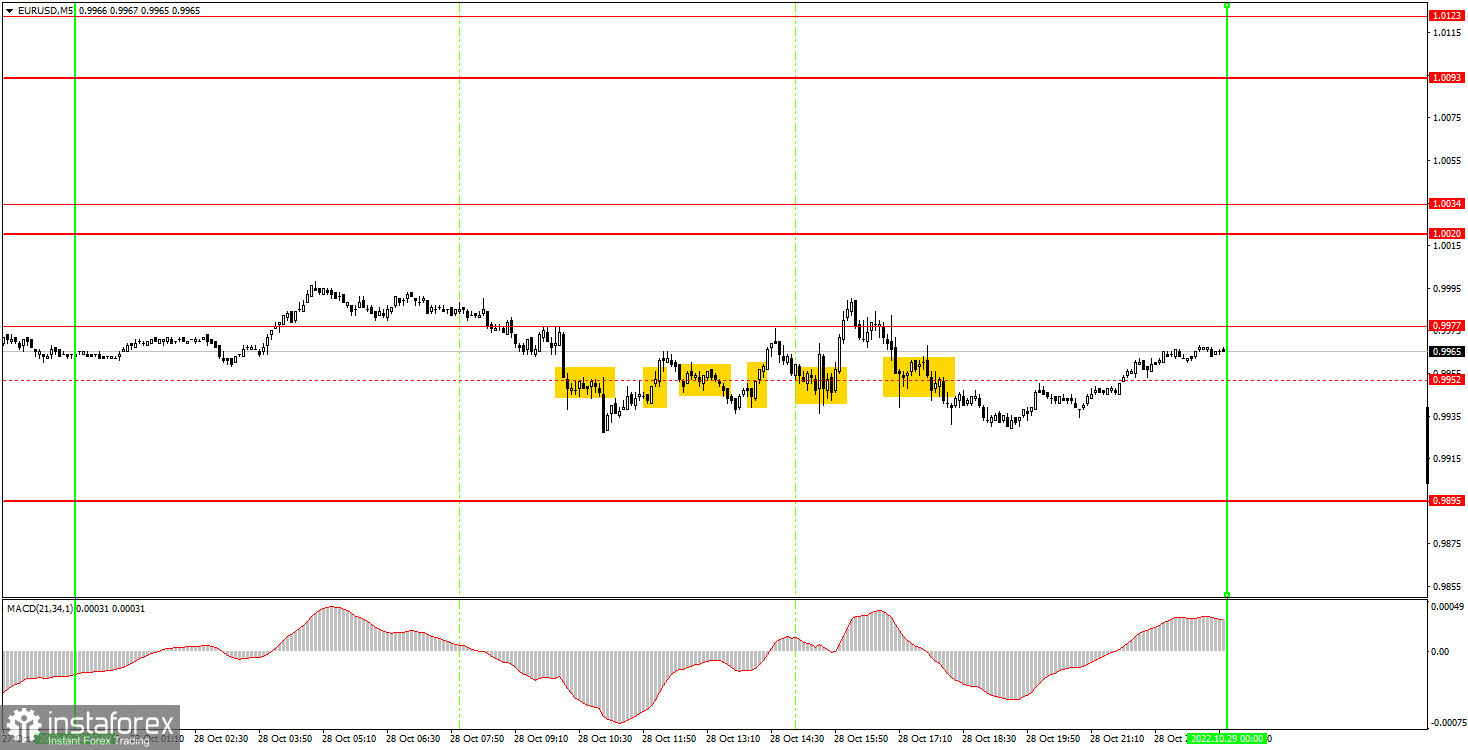
You can see even better on the 5-minute timeframe that the pair nearly spent the entire Friday in horizontal movement. The level of 0.9977 is new, and 0.9952 was recognized as irrelevant by the end of the day. However, all trading signals of the day were formed exactly around 0.9952. Thus, the day turned out to be very unfortunate in terms of trading. Novice traders could try to work out only the first two signals, since at that time it was not yet clear that the flat had begun. However, it was not even possible to place a Stop Loss on both positions, so a small loss was received on both. Unfortunately, from time to time there are days when it is not possible to make a profit.
How to trade on Monday:
The pair has consolidated below the trend line on the 30-minute timeframe, so next week we expect a fall. Moreover, the Fed rate hike should also provoke the strengthening of the US currency, that is, the fall of the euro/dollar pair. On the 5-minute TF tomorrow it is recommended to trade at the levels of 0.9756, 0.9807, 0.9877, 0.9977, 1.0020-1.0034, 1.0072, 1.0123, 1.0156, 1.0221. When passing 15 points in the right direction, you should set Stop Loss to breakeven. The European Union will publish a report on GDP for the third quarter, which can be very interesting amid all the talk about an impending recession. An inflation report will also be published, which is even more interesting, as the ECB raises the rate, and forecasts say that the consumer price index will rise again, this time to 10.2-10.4%. Thus, very volatile movements await us tomorrow.
Basic rules of the trading system:
1) The signal strength is calculated by the time it took to form the signal (bounce or overcome the level). The less time it took, the stronger the signal.
2) If two or more positions were opened near a certain level based on false signals (which did not trigger Take Profit or the nearest target level), then all subsequent signals from this level should be ignored.
3) In a flat, any pair can form a lot of false signals or not form them at all. But in any case, at the first signs of a flat, it is better to stop trading.
4) Trade positions are opened in the time period between the beginning of the European session and until the middle of the US one, when all positions must be closed manually.
5) On the 30-minute TF, using signals from the MACD indicator, you can trade only if there is good volatility and a trend, which is confirmed by a trend line or a trend channel.
6) If two levels are located too close to each other (from 5 to 15 points), then they should be considered as an area of support or resistance.
On the chart:
Support and Resistance Levels are the Levels that serve as targets when buying or selling the pair. You can place Take Profit near these levels.
Red lines are the channels or trend lines that display the current trend and show in which direction it is better to trade now.
The MACD indicator (14,22,3) consists of a histogram and a signal line. When they cross, this is a signal to enter the market. It is recommended to use this indicator in combination with trend lines (channels and trend lines).
Important speeches and reports (always contained in the news calendar) can greatly influence the movement of a currency pair. Therefore, during their exit, it is recommended to trade as carefully as possible or exit the market in order to avoid a sharp price reversal against the previous movement.
Beginners on Forex should remember that not every single trade has to be profitable. The development of a clear strategy and money management are the key to success in trading over a long period of time.


