


Analysis of Friday's deals:
30M chart of the GBP/USD pair
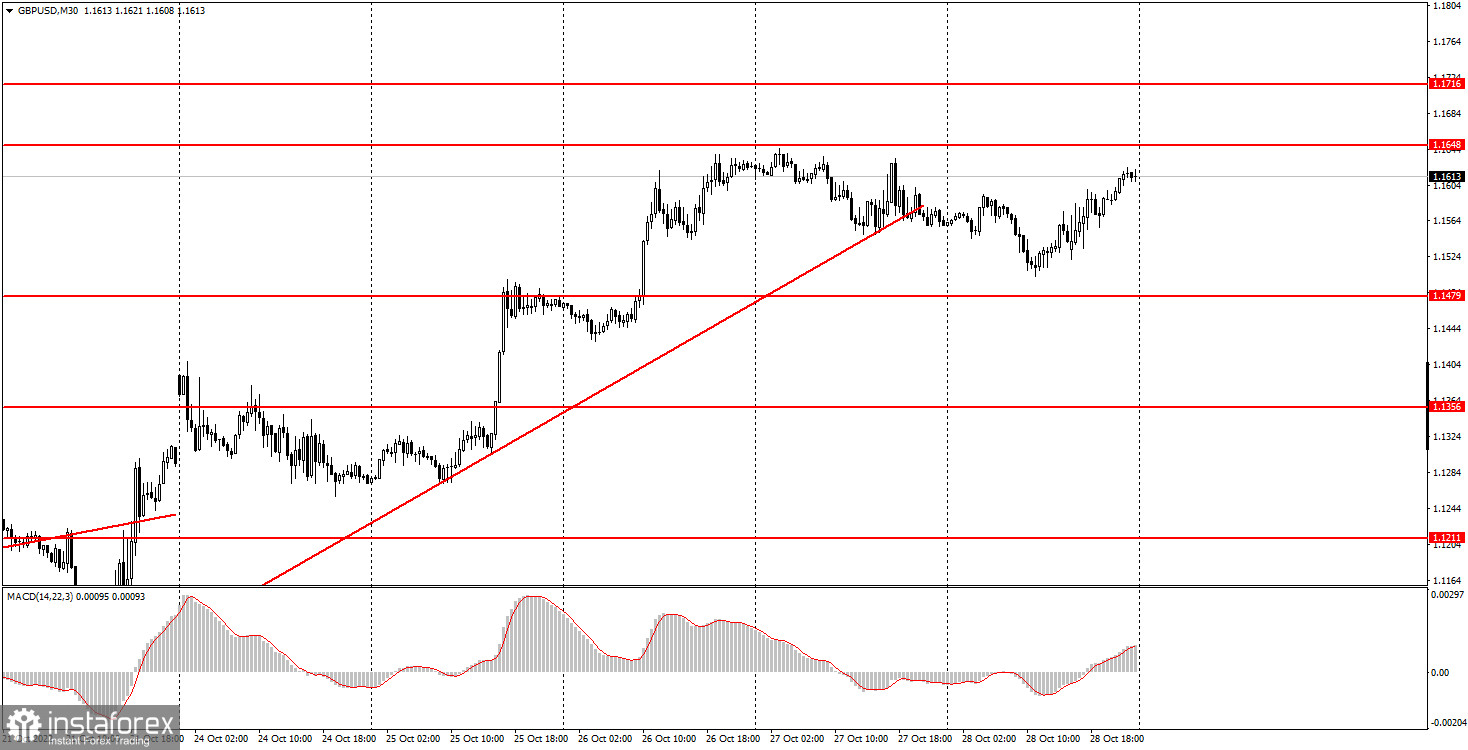
The GBP/USD pair tried to continue its downward movement on Friday after settling below the trend line, however, the upward movement resumed in the afternoon, so at the moment it is not at all obvious that the pound will start to fall. We have repeatedly said before that the British currency has a greater chance of growth than the euro. In reality, this is exactly what happens. The euro was flat on Friday, and the pound rose by the end of the day. The pound moved away from its annual lows by 1,300 points, and the euro - by only 550. There were no important events and reports in the UK on Friday, just like last week. Thus, there was practically nothing for traders to react to, except for several reports in the US, which turned out to be as neutral as possible. However, during the day the volatility was about 120 points, which is neither too much nor too little. The pound has accustomed us to high volatility in recent weeks, so 120 points now looks undignified. In general, even considering that the pound and the euro are unlikely to move radically differently, we believe that the British currency is more likely to continue to grow.
5M chart of the GBP/USD pair
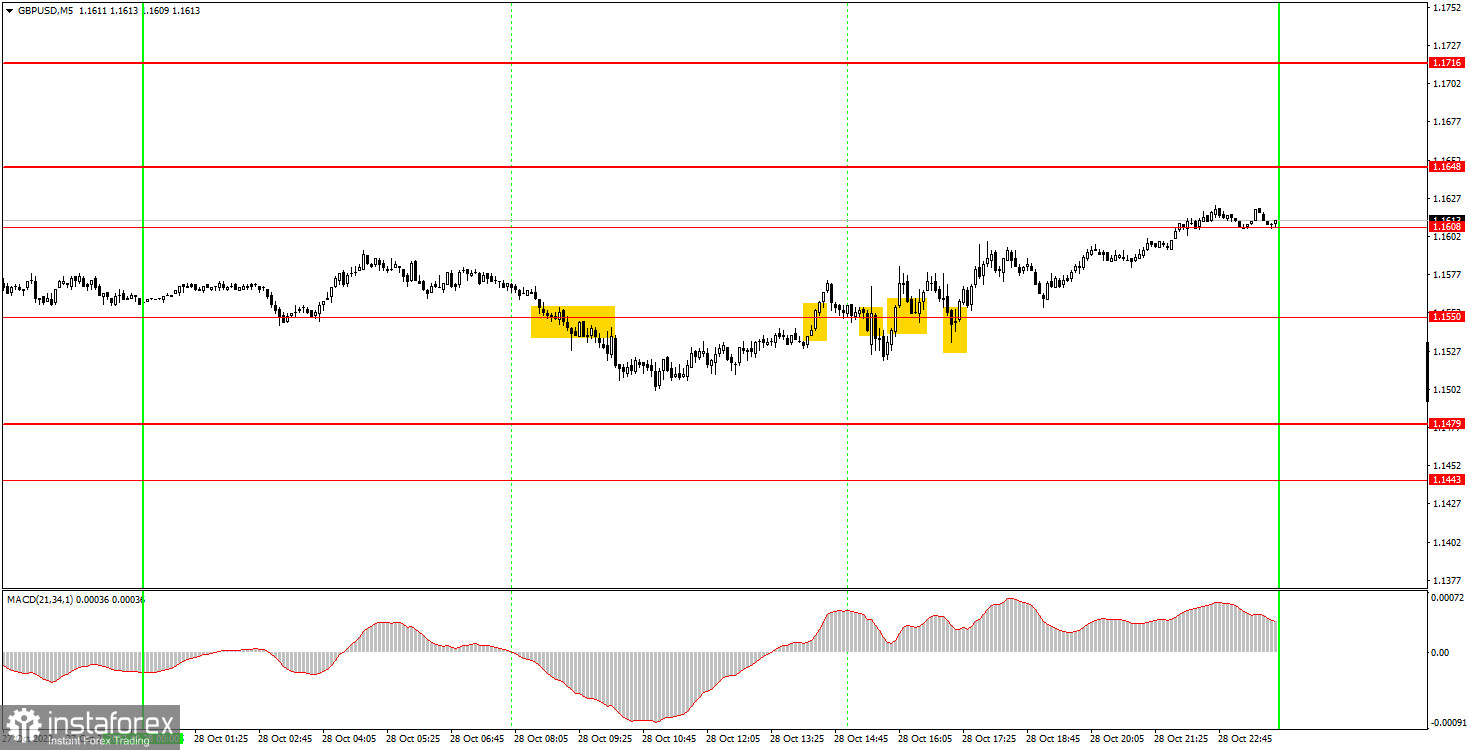
You can clearly see on the 5-minute timeframe that there was no pronounced flat on Friday. Quotes, of course, for quite a long time were near the level of 1.1550, but still moved in a more trendy manner. The first sell signal was formed at the beginning of the European trading session, when the price settled below 1.1550. After that, it passed about 30 points down, which allowed beginners to set Stop Loss to breakeven, at which the position was closed. The second buy signal also turned out to be false, and the price could not even go up 20 points. Therefore, there was a small loss here. Since the first two signals turned out to be false, all the subsequent signals around the same level of 1.1550 should not have been worked out. As a result, the day ended with a minimal loss. It's okay.
How to trade on Monday:
The pound/dollar pair has overcome the ascending trend line on the 30-minute time frame, but has not yet been able to continue moving down. It is possible that the upward trend will continue, and the trend line will again have to be rebuilt. Next week the meetings of the Bank of England and the Federal Reserve will take place, so the pair can "fly" from side to side and show the highest volatility. On the 5-minute TF tomorrow it is recommended to trade at the levels 1.1356, 1.1443, 1.1479, 1.1550, 1.1608, 1.1648, 1.1716, 1.1755, 1.1793, 1.1863- 1.1877. When the price passes after opening a position in the right direction for 20 points, Stop Loss should be set to breakeven. There are no important events scheduled for Monday in the UK, and the calendar of events in the US is also empty. However, a little later in the week there will be very important events that the market can start working out in advance.
Basic rules of the trading system:
1) The signal strength is calculated by the time it took to form the signal (bounce or overcome the level). The less time it took, the stronger the signal.
2) If two or more positions were opened near a certain level based on false signals (which did not trigger Take Profit or the nearest target level), then all subsequent signals from this level should be ignored.
3) In a flat, any pair can form a lot of false signals or not form them at all. But in any case, at the first signs of a flat, it is better to stop trading.
4) Trade positions are opened in the time period between the beginning of the European session and until the middle of the US one, when all positions must be closed manually.
5) On the 30-minute TF, using signals from the MACD indicator, you can trade only if there is good volatility and a trend, which is confirmed by a trend line or a trend channel.
6) If two levels are located too close to each other (from 5 to 15 points), then they should be considered as an area of support or resistance.
On the chart:
Support and Resistance Levels are the Levels that serve as targets when buying or selling the pair. You can place Take Profit near these levels.
Red lines are the channels or trend lines that display the current trend and show in which direction it is better to trade now.
The MACD indicator (14,22,3) consists of a histogram and a signal line. When they cross, this is a signal to enter the market. It is recommended to use this indicator in combination with trend lines (channels and trend lines).
Important speeches and reports (always contained in the news calendar) can greatly influence the movement of a currency pair. Therefore, during their exit, it is recommended to trade as carefully as possible or exit the market in order to avoid a sharp price reversal against the previous movement.
Beginners on Forex should remember that not every single trade has to be profitable. The development of a clear strategy and money management are the key to success in trading over a long period of time.


