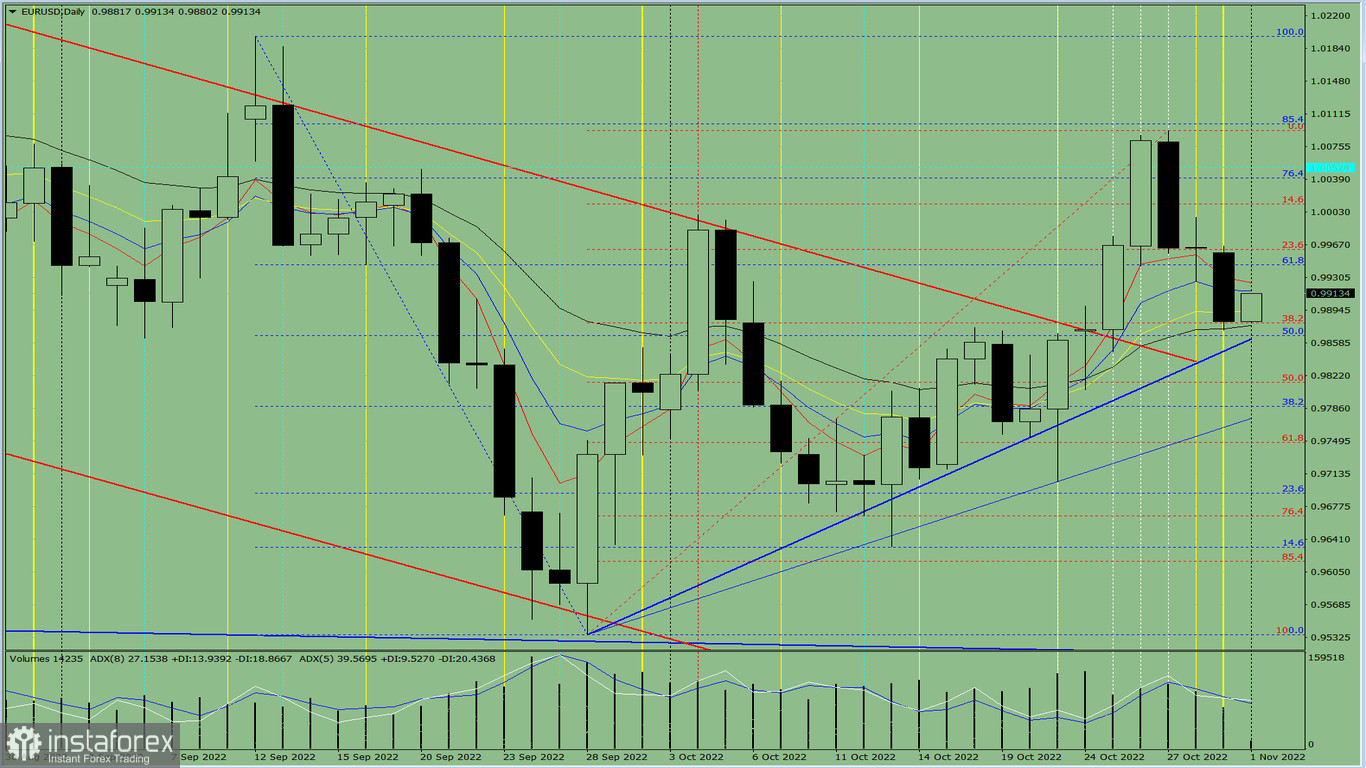
Trend-following analysis (picture 1)
On Tuesday, moving up from 0.9882 where yesterday's intraday candlestick closed, the currency pair is trying to reach 0.9944 which matches the 61.8% Fibonacci retracement plotted by the blue dotted line. Once the level is tested, the price will continue its upward move, aiming to reach 1.0040, the 76.4% Fibonacci retracement plotted by the blue dotted line. From this level, the price could pull back downward with the target at 1.0012 which corresponds to the 14.6% Fibonacci retracement plotted by the red dotted line.

Daily chart (picture 1)
Complex analysis
Indicator analysis - up
Fibonacci levels – up
Trading volume – up
Candlestick analysis – up
Trend-following analysis – up
Bollinger bands – up
Weekly chart – up
Conclusion
Today, moving up from 0.9882 where yesterday's intraday candlestick closed, the currency pair is trying to reach 0.9944 which matches the 61.8% Fibonacci retracement plotted by the blue dotted line. Once the level is tested, the price will continue its upward move, aiming to reach 1.0040, the 76.4% Fibonacci retracement plotted by the blue dotted line. From this level, the price could pull back downward with the target at 1.0012 which corresponds to the 14.6% Fibonacci retracement plotted by the red dotted line.
Alternative scenario
Today, the trading instrument is moving up from 0.9882 where yesterday's intraday candlestick closed. The price aims to reach 0.9944 which matches the 61.8% Fibonacci retracement plotted by the blue dotted line. When this level is tested, the currency pair might move downward, aiming to reach 0.9880, the 38.2% Fibonacci retracement plotted by the red dotted line. EUR/USD could rebound from this level.


