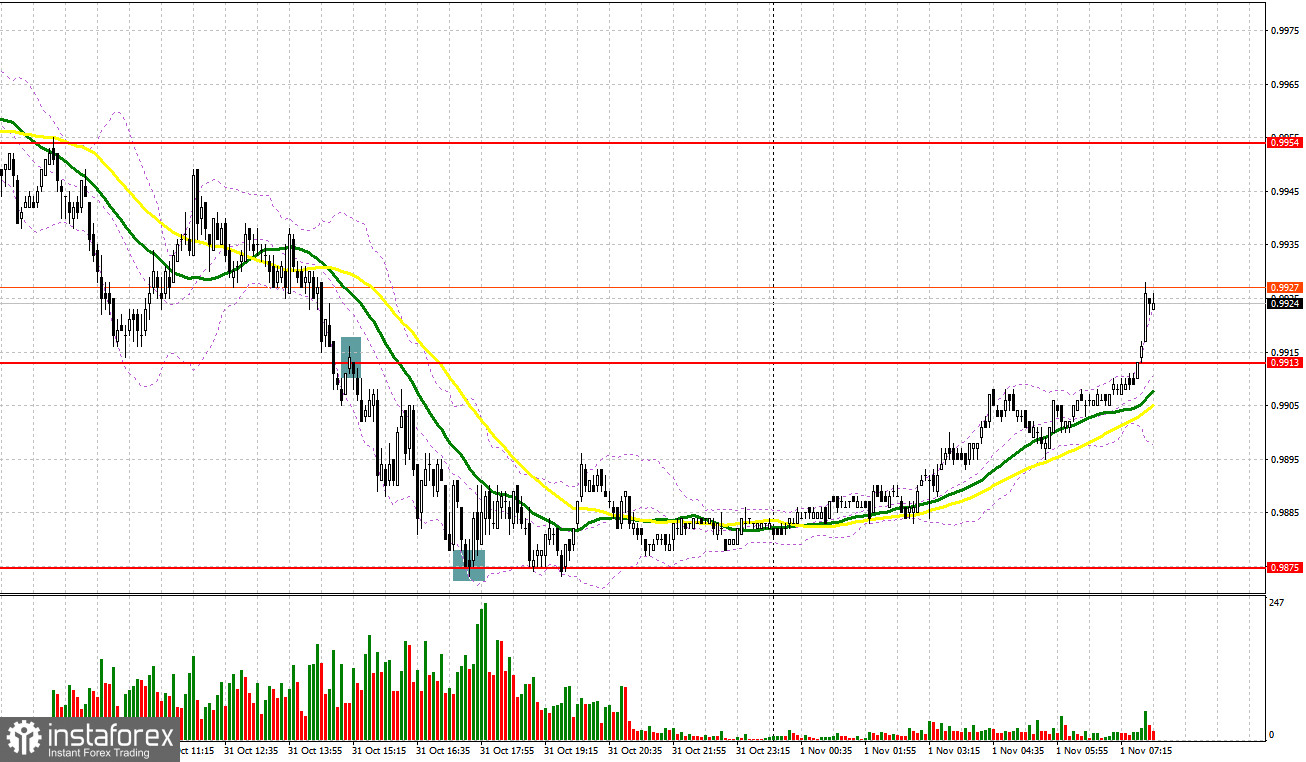
Yesterday was a pretty good trading day. Let's take a look at the 5-minute chart and see what happened. Earlier, I asked you to pay attention to the 0.9930 level to decide when to enter the market. Everything happened by analogy with last Friday, so nothing good could be obtained from the received signal in the first half of the day. A decline, breakout of 0.9930 and an upward test led to a sell signal, however, the pair went further down, and so traders suffered losses. The US session turned out to be much better: a breakthrough and reverse test from below 0.9913 gave a sell signal, which resulted in a downward move by more than 35 points. The bulls protecting support at 0.9875 and a false breakout on it - all this led to long positions and the pair moved up by 20 points.

When to go long on EUR/USD:
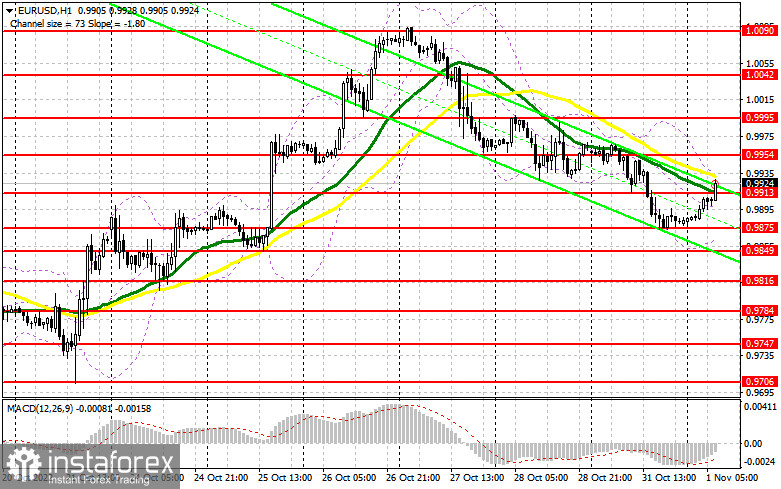
Yesterday's eurozone GDP report gave confidence that the economy will actually contract by the end of the year and this is unlikely to be avoided. Inflation growth continued in October and exceeded 10.7%, which will force the European Central Bank to continue acting aggressively: raising rates, while counting on a quick return of consumer prices to an acceptable level. Today there are no statistics that could somehow turn the market, so it is possible that the euro will be able to return to the opening levels of the week before the Federal Reserve meeting, the results of which will be known tomorrow. If the pair goes down, forming a false breakout in the area of the nearest support at 0.9913 will be an excellent reason to build up long positions with the prospect of the euro's further recovery along the trend towards 0.9954 and 1.0000. We can talk about new attempts by the bulls to strengthen market control after the breakout of parity and the test from the down up. A breakthrough of 1.0000 would hit bearish stops and form a buy signal with the possibility of a push higher to the 1.0042 area, strengthening the bullish trend. An exit above 1.0042 will serve as a reason for growth to the area of the weekly high of 1.0090, where I recommend taking profits.
In case the pair drops and bulls fail to protect 0.9913, the pressure on the euro will reverse, thus causing another slump. In this case, it will be wise to go long on a false breakout near 0.9875. It is also possible to buy the asset just after a bounce off 0.9849, or even lower - 0.9816, expecting a rise of 30-35 pips.
When to go short on EUR/USD:
The bears have managed to prove themselves, but have lost all the advantage in today's Asian session. It's more like running stops before key US data, so don't be surprised if the market moves against common sense in the coming days, of which there is very little in it. Today, bears should primarily protect the resistance at 0.9954, just below which are moving averages, playing on their side. It would be better to open short positions after a false breakout of this level after obscure statistics on the German import price index, which will provide an excellent entry point, allowing a return to 0.9913. If the pair settles below this level and upwardly tests it, traders may go short to push the price to the 0.9875 area, where bears may face serious obstacles. The farthest target is located at 0.9849, where I recommend taking profits. If EUR/USD moves up during the European session and bears fail to protect 0.9954, demand for the pair will jump, thus prolonging the upward trend. In this case, bears should remain cautious. They may open positions after a false breakout of 1.0000. It is also possible to go short after a rebound from the monthly high of 1.0042 or higher – from 1.0090, expecting a decline of 30-35 pips.

Signals of indicators:
Moving averages
Trading is performed below the 30- and 50-day moving averages, which shows that the pair is still under pressure.
Note: The period and prices of moving averages are considered by the author on the one-hour chart, which differs from the general definition of the classic daily moving averages on the daily chart.
Bollinger Bands
If the euro/dollar pair rises, the upper limit of the indicator located at 0.9935 will act as resistance. If the pair drops, the lower limit of the indicator will act as support.
Description of indicators
- Moving average (moving average, determines the current trend by smoothing volatility and noise). The period is 50. It is marked in yellow on the chart.
- Moving average (moving average, determines the current trend by smoothing volatility and noise). The period is 30. It is marked in green on the graph.
- MACD indicator (Moving Average Convergence/Divergence - convergence/divergence of moving averages). A fast EMA period is 12. A slow EMA period is 26. The SMA period is 9.
- Bollinger Bands. The period is 20.
- Non-profit speculative traders are individual traders, hedge funds, and large institutions that use the futures market for speculative purposes and meet certain requirements.
- Long non-commercial positions are the total number of long positions opened by non-commercial traders.
- Short non-commercial positions are the total number of short positions opened by non-commercial traders.
- The total non-commercial net position is a difference in the number of short and long positions opened by non-commercial traders.


