


Analysis of Friday's deals:
30M chart of the EUR/USD pair
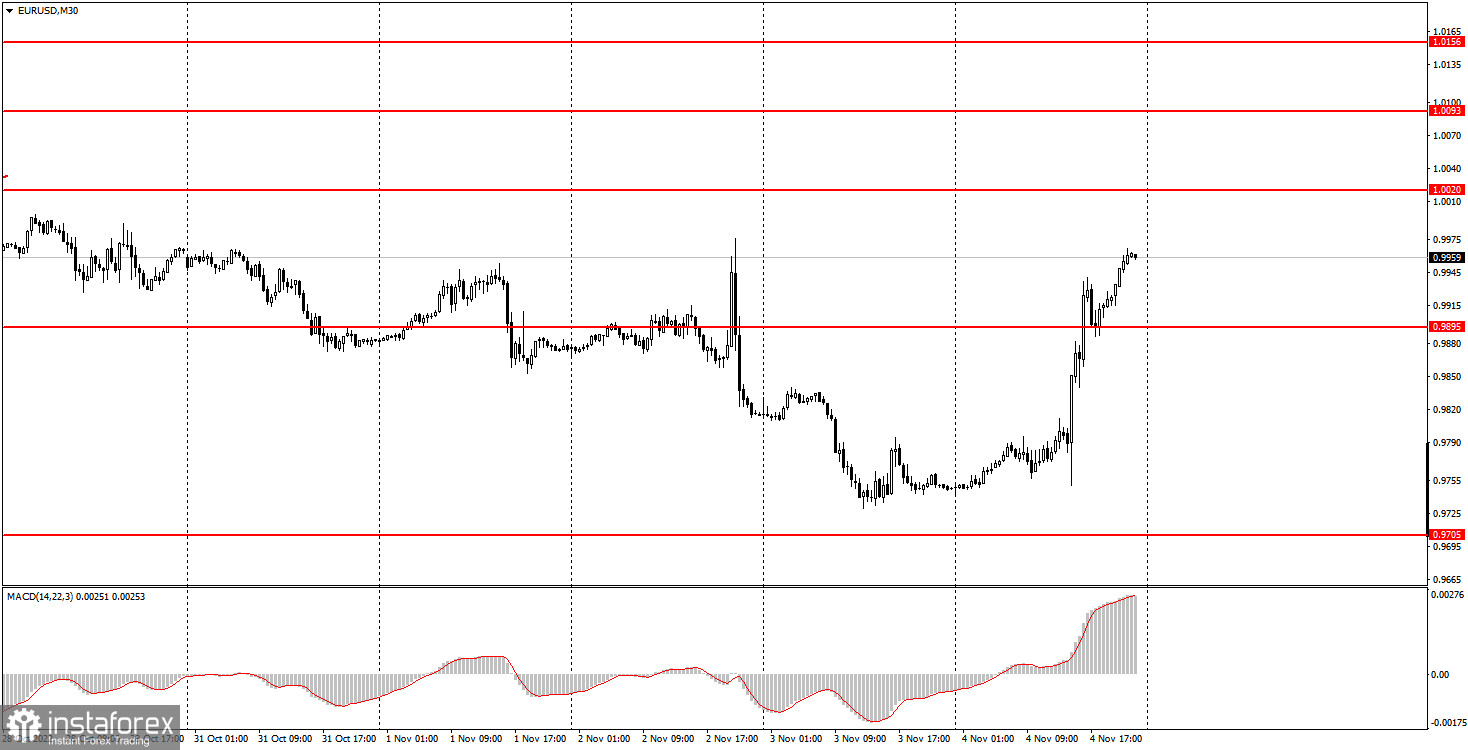
The EUR/USD currency pair continued to "fly" from side to side on Friday. We warned you that the last three trading days of this week could be very volatile, which is what we ended up with. However, Friday surprised even us. Let's start with the fact that important statistics from America would be released on this day. NonFarm Payrolls reports and unemployment have always been very significant for the market, so from the very beginning one could count on good movement. It was just a matter of finding out which way. Here, at first glance, everything was quite simple. If the reports are better than forecasts, then the dollar should have risen. If not, then the euro. However, in the end, the Nonfarm report turned out to be stronger than the forecasted values, and unemployment was worse. Therefore, it was necessary to understand which of the reports is more important for the market. Given that the dollar fell by 200 points, traders paid more attention to unemployment, which rose again to 3.7%. We believe that the market's reaction was illogical, as the Nonfarm report is still more important. It follows that the market may try to correct its mistake on Monday and buy the US currency.
5M chart of the EUR/USD pair
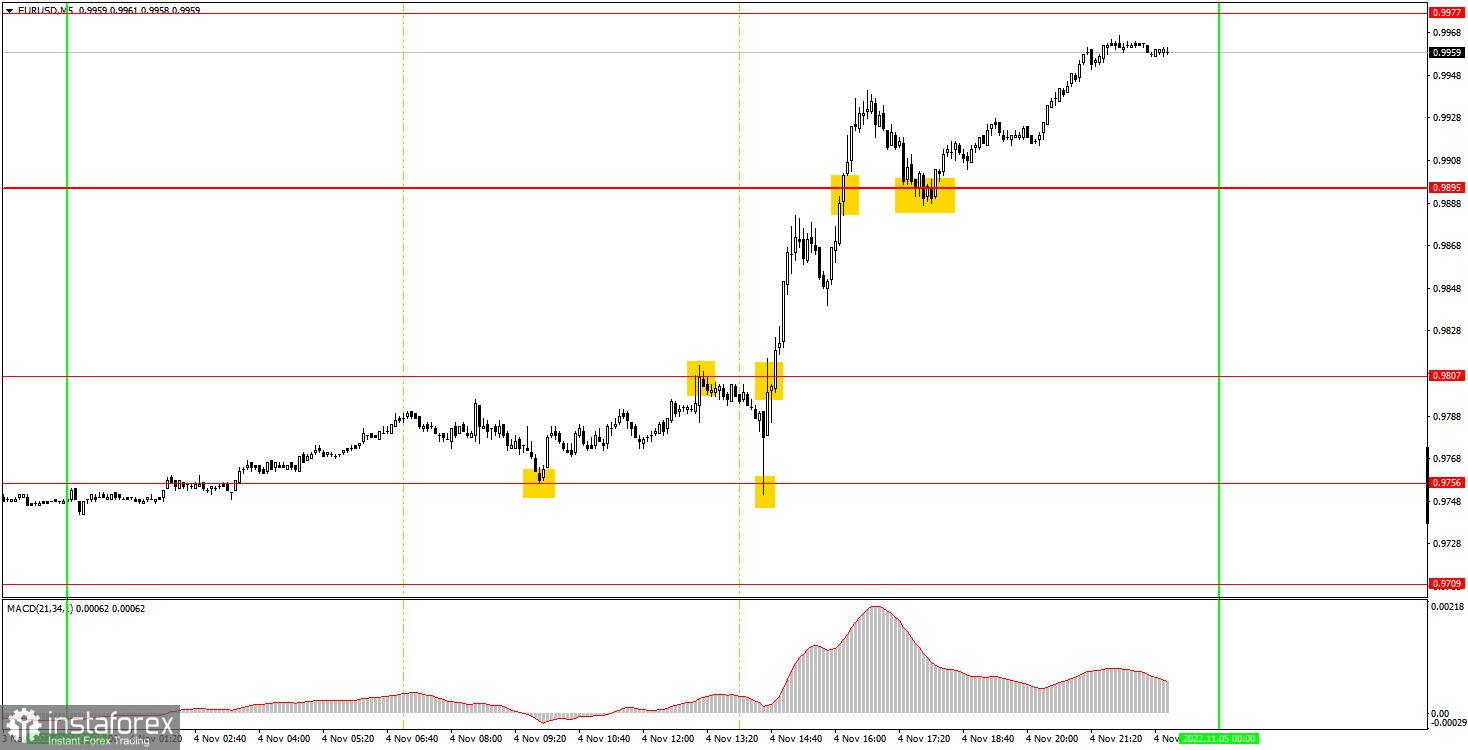
There were enough trading signals on the 5-minute timeframe on Friday. We draw your attention to the fact that all levels were worked out almost perfectly, and the movement was volatile, which is always good. The first trading signal was near the level of 0.9756. It should have been worked out with a long position, after which the price rose to the level of 0.9807, from which it rebounded. Therefore, longs should have been closed in profit of about 15 points. But the signal to sell near 0.9807 should not have been traded, since important reports in the US were to be published in half an hour. When they became available, the pair bounced again from the 0.9756 level and broke the 0.9807 level. Only a signal around 0.9807 could be worked out again with a long. After that, the pair soared, overcame 0.9895, and then bounced off it again from above. Since the signal to sell was not already formed, the long had to be closed manually. Profit on it amounted to about 100 points.
How to trade on Monday:
The pair unexpectedly rushed up on the 30-minute timeframe, so the downward trend is called into question. We consider Friday's upward movement to be illogical, and remember that earlier, on Wednesday, there was also a Federal Reserve meeting, which can be considered a hawkish one. Therefore, the dollar has much more reasons to return to growth than the euro. On the 5-minute TF tomorrow it is recommended to trade at the levels of 0.9709, 0.9756, 0.9807, 0.9895, 0.9977, 1.0020-1.0034, 1.0093, 1.0123, 1.0156. When passing 15 points in the right direction, you should set Stop Loss to breakeven. On Monday, neither the United States nor the European Union has a single important event planned. Therefore, there will be nothing for traders to react during the day. But we believe that the market may sell the pair on this day, as the reaction on Friday was illogical.
Basic rules of the trading system:
1) The signal strength is calculated by the time it took to form the signal (bounce or overcome the level). The less time it took, the stronger the signal.
2) If two or more positions were opened near a certain level based on false signals (which did not trigger Take Profit or the nearest target level), then all subsequent signals from this level should be ignored.
3) In a flat, any pair can form a lot of false signals or not form them at all. But in any case, at the first signs of a flat, it is better to stop trading.
4) Trade positions are opened in the time period between the beginning of the European session and until the middle of the US one, when all positions must be closed manually.
5) On the 30-minute TF, using signals from the MACD indicator, you can trade only if there is good volatility and a trend, which is confirmed by a trend line or a trend channel.
6) If two levels are located too close to each other (from 5 to 15 points), then they should be considered as an area of support or resistance.
On the chart:
Support and Resistance Levels are the Levels that serve as targets when buying or selling the pair. You can place Take Profit near these levels.
Red lines are the channels or trend lines that display the current trend and show in which direction it is better to trade now.
The MACD indicator (14,22,3) consists of a histogram and a signal line. When they cross, this is a signal to enter the market. It is recommended to use this indicator in combination with trend lines (channels and trend lines).
Important speeches and reports (always contained in the news calendar) can greatly influence the movement of a currency pair. Therefore, during their exit, it is recommended to trade as carefully as possible or exit the market in order to avoid a sharp price reversal against the previous movement.
Beginners on Forex should remember that not every single trade has to be profitable. The development of a clear strategy and money management are the key to success in trading over a long period of time.


