


Analysis of Friday's deals:
30M chart of the GBP/USD pair
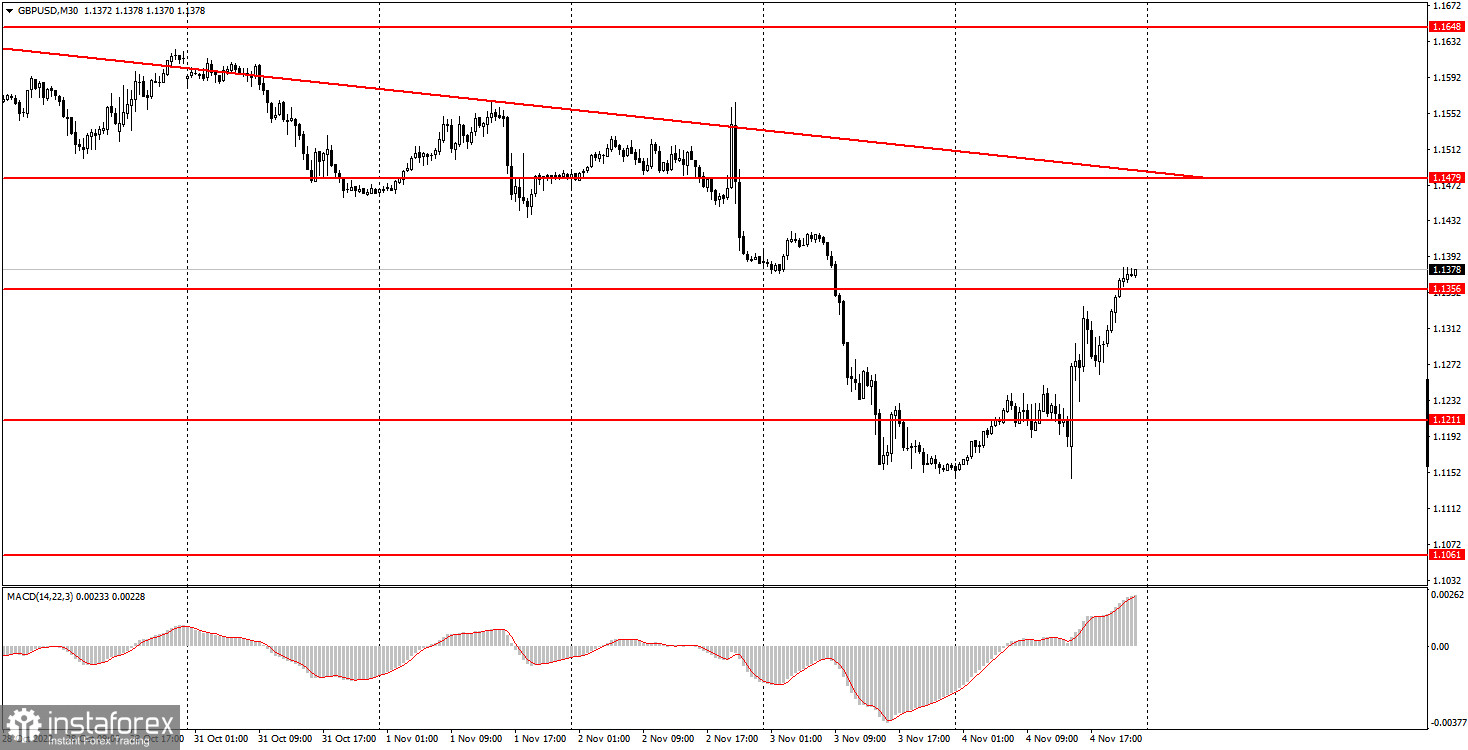
The GBP/USD pair showed movements similar to the EUR/USD pair on Friday, which, however, is not surprising, since all the most important events of the day were related to America. As in the case of the euro, we believe that the dollar's fall against the pound was not justified, as the US statistics on the labor market were quite good. The unemployment rate rose by 0.2%, but it still remains near its 50-year lows, so an increase of 0.1-0.2% does not play a special role. Moreover, earlier this week there were meetings of the Bank of England and the Federal Reserve, which the market also did not work out very logically, as both central banks raised their rates, but only the dollar grew. So maybe on Friday we saw Thursday's "bug fixes". Or maybe on Monday we'll see Friday's "bug fixes". One way or another, but the pound remains within the downward trend, as evidenced by the trend line. The euro and the pound are still out of their element, so we fully assume that in the medium term they will resume their decline.
5M chart of the GBP/USD pair
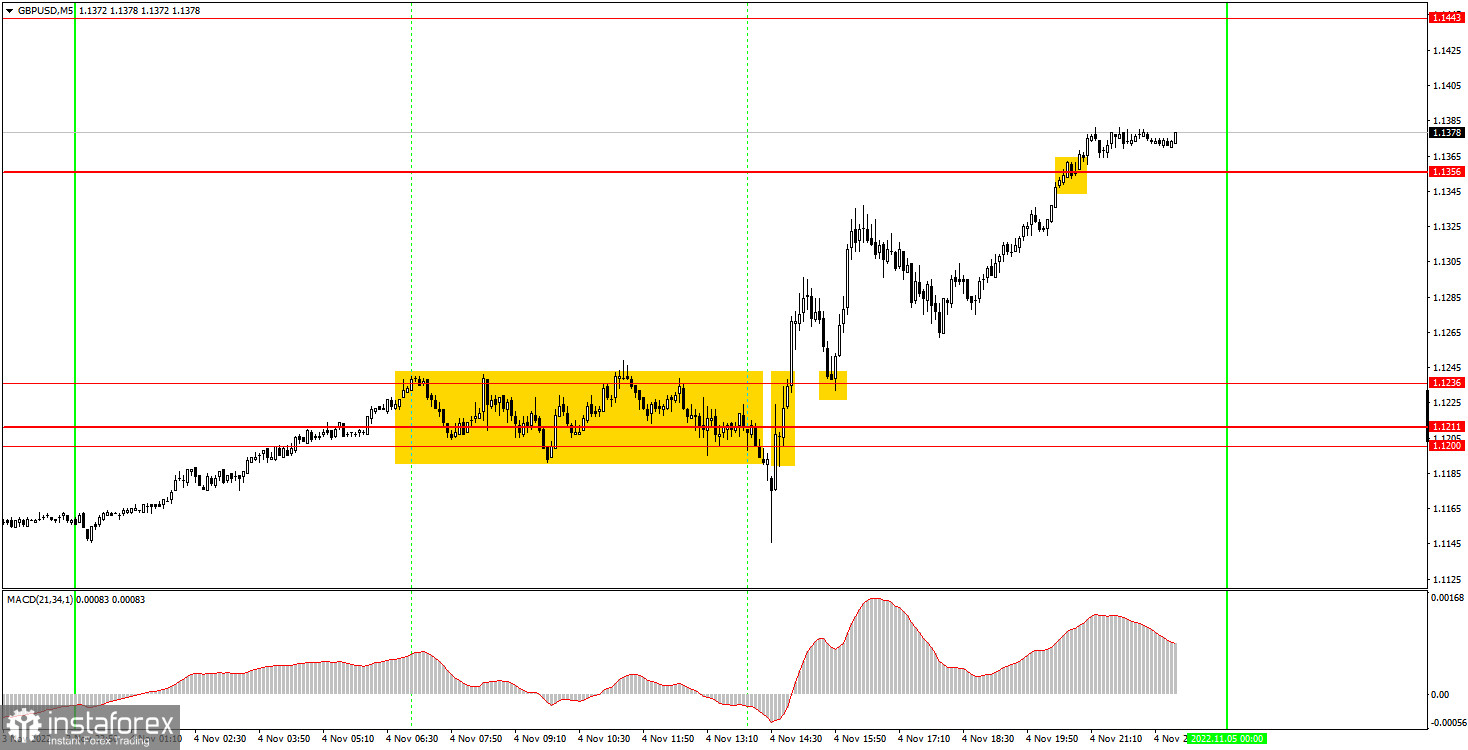
On the 5-minute timeframe for the pound, trading signals were not as great as for the euro, but still the key levels worked out very well. For example, during the European trading session, during which there was an absolute flat, the price almost never went beyond the 1.1200-1.1236 area. And so, there was no false signal. The quotes only settled below 1.1200 at the time when the US reports were released, but this signal, for obvious reasons, should not have been worked out. But the next buy signal about settling above the level of 1.1236, although it was not the most accurate, could have been worked out. After that, the pair rose to the level of 1.1356, but the position should have been closed earlier, since the level of 1.1356 was worked out almost at the close of trading. However, about 50 pips of profit could be made.
How to trade on Monday:
The pound/dollar pair maintains a downward trend on the 30-minute time frame, but on Friday showed an increase of 220 points. We believe that on Monday the market can sell the pair, as the end of the last week turned out to be very chaotic and there is no certainty that traders completely and logically took into account all the data they received. On the 5-minute TF tomorrow it is recommended to trade at the levels of 1.0927, 1.1061, 1.1200-1.1211-1.1236, 1.1356, 1.1443, 1.1479, 1.1550. When the price passes after opening a position in the right direction for 20 points, Stop Loss should be set to breakeven. There are no major reports or other events scheduled for Monday in the UK and US. However, after a crazy last week, the market may continue to trade very actively.
Basic rules of the trading system:
1) The signal strength is calculated by the time it took to form the signal (bounce or overcome the level). The less time it took, the stronger the signal.
2) If two or more positions were opened near a certain level based on false signals (which did not trigger Take Profit or the nearest target level), then all subsequent signals from this level should be ignored.
3) In a flat, any pair can form a lot of false signals or not form them at all. But in any case, at the first signs of a flat, it is better to stop trading.
4) Trade positions are opened in the time period between the beginning of the European session and until the middle of the US one, when all positions must be closed manually.
5) On the 30-minute TF, using signals from the MACD indicator, you can trade only if there is good volatility and a trend, which is confirmed by a trend line or a trend channel.
6) If two levels are located too close to each other (from 5 to 15 points), then they should be considered as an area of support or resistance.
On the chart:
Support and Resistance Levels are the Levels that serve as targets when buying or selling the pair. You can place Take Profit near these levels.
Red lines are the channels or trend lines that display the current trend and show in which direction it is better to trade now.
The MACD indicator (14,22,3) consists of a histogram and a signal line. When they cross, this is a signal to enter the market. It is recommended to use this indicator in combination with trend lines (channels and trend lines).
Important speeches and reports (always contained in the news calendar) can greatly influence the movement of a currency pair. Therefore, during their exit, it is recommended to trade as carefully as possible or exit the market in order to avoid a sharp price reversal against the previous movement.
Beginners on Forex should remember that not every single trade has to be profitable. The development of a clear strategy and money management are the key to success in trading over a long period of time.


