Details of the economic calendar from November 8
The midterm elections to the US Congress are in the center of everyone's attention. During which the House of Representatives and a third of the Senate will be re-elected. The first polling stations closed in a number of districts of Indiana and Kentucky at 23:00 UTC, and the last at 05:00 UTC - stations in Alaska and Hawaii stopped accepting ballots.
Ballot counting is still ongoing. As a result, 435 members of the House of Representatives and a third of its Senate will be elected. In addition, the governors of 36 states and three US overseas territories are elected.
As I wrote in the previous article, the victory of the Republicans will lead to heavy clashes in promoting legislative initiatives of the White House. As a result, characteristic uncertainty and even investors' fears may arise, which will lead to the sale of the US dollar.
Analysis of trading charts from November 8
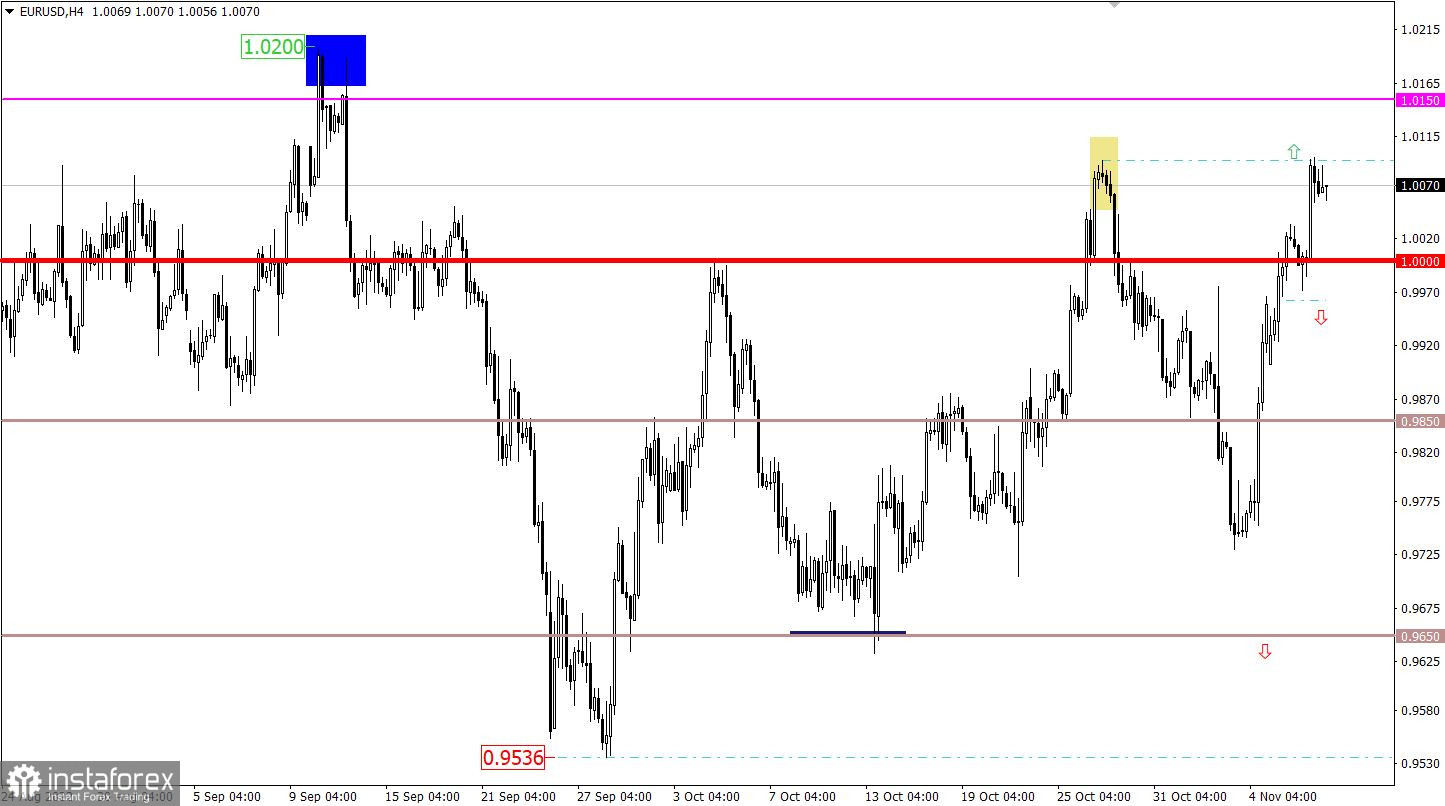
The EUR/USD currency pair continues to show an upward trend in the market. A short stagnation within the parity level was replaced by a subsequent inertial move, which let the quote approach the local high of October.
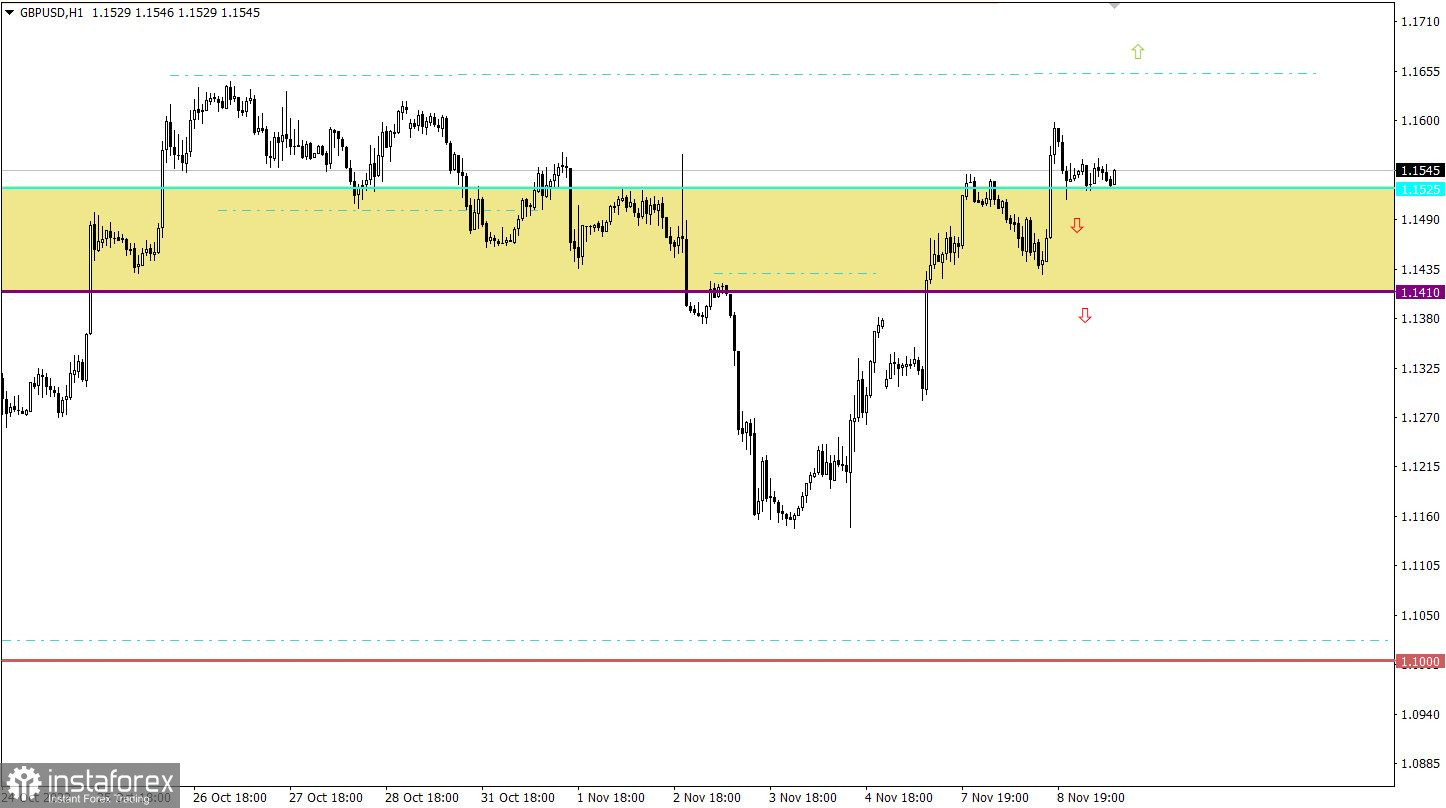
The GBP/USD currency pair managed to maintain the upward cycle previously set in the market during the impulse jump. As a result, the quote remained above the 1.1525 mark. The scale of the strengthening of the pound sterling from November 4 to November 8 is about 400 points.

Economic calendar for November 9
Today, the macroeconomic calendar is empty, and it would not be of interest to traders because all their attention is focused on counting ballots.
Thus, investors and traders will monitor the information and news flow coming to the media and act on the market in relation to it.
Trading plan for EUR/USD on November 9
In this situation, the value of 1.0100 is considered a variable resistance level. In order for there to be a subsequent increase in the volume of long positions, the quote needs to stay above this value for at least a four-hour period. In this case, both the current upward cycle and the corrective move from the bottom of the downward trend will be prolonged.
At the same time, traders are considering the scenario of a price rebound from 1.0100. In this case, the inertial move may be interrupted, and the quote will return to the parity level limit.

Trading plan for GBP/USD on November 9
A stable holding of the price above 1.1525 may lead to a prolongation of the upward cycle. Under this scenario, it is possible to update the local high of October, which, in turn, will open the way in the direction of the resistance level 1.1750.
As for the downward scenario, it will again be considered by traders in case the price returns to the boundaries of the area of interaction of trading forces 1.1410/1.1525.

What is shown in the trading charts?
A candlestick chart view is graphical rectangles of white and black light, with sticks on top and bottom. When analyzing each candle in detail, you will see its characteristics of a relative period: the opening price, closing price, and maximum and minimum prices.
Horizontal levels are price coordinates, relative to which a stop or a price reversal may occur. These levels are called support and resistance in the market.
Circles and rectangles are highlighted examples where the price of the story unfolded. This color selection indicates horizontal lines that may put pressure on the quote in the future.
The up/down arrows are the reference points of the possible price direction in the future.


