


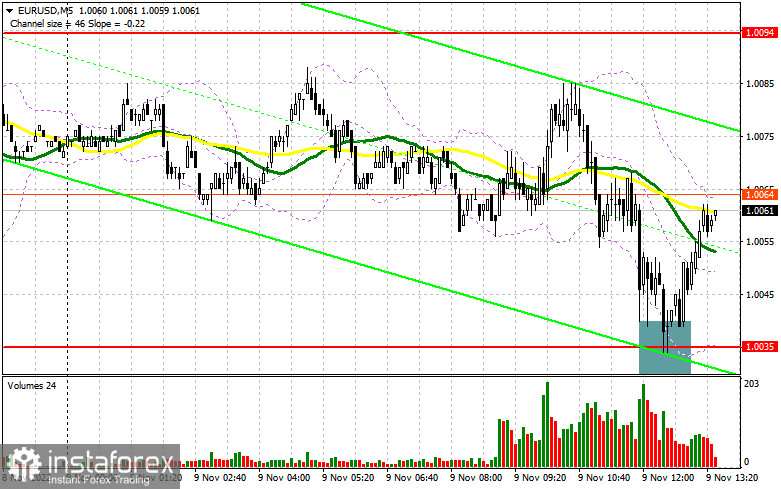
In the morning article, I turned your attention to 1.0035 and recommended making decisions with this level in focus. Now, let's look at the 5-minute chart and figure out what actually happened. A decline and a false breakout of 1.0035 gave a buy signal. At the time of writing the article, the pair has already climbed by more than 30 pips. So, it is highly likely to break through the 1.0094 level in the afternoon. For this reason, the technical outlook as well as the trading strategy remained unchanged for the second half of the day.
When to open long positions on EUR/USD:
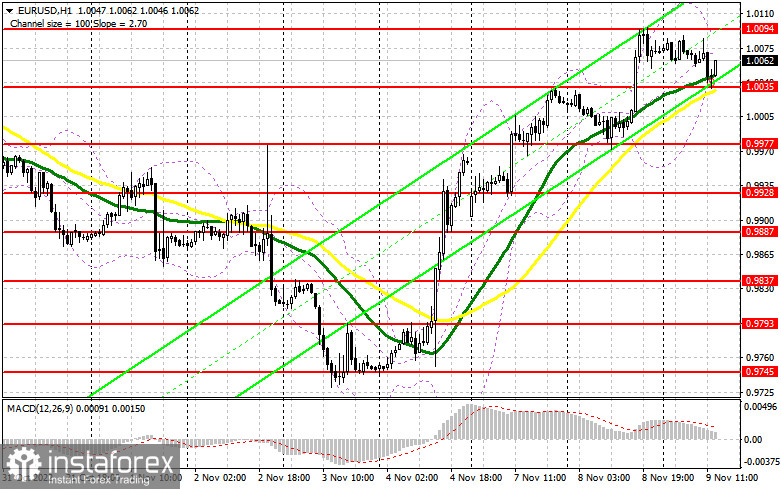
The US economic calendar is empty today. This is why traders will be mainly focused on the speeches of Fed policymakers John Williams and Thomas Barkin. The US Wholesale Inventories report will hardly impact market sentiment. As long as the pair is trading above 1.0035, there is a high chance of the continuation of the uptrend and a rise to 1.0094. In case of a decline during the American session, it is better to pay attention to the support level of 1.0035. Only a false breakout of this level, similar to the one I have discussed above, will provide a buy signal. If so, it will foster the uptrend. it could the pair return to the resistance level of 1.0094. A breakout and a downward test of this level will open the way to 1.0136. The pair could consolidate above the parity level, boosting a further upward movement to 1.0182. At this level, I recommend locking in profits. A more distant target will be the 1.0218 level. If EUR/USD drops during the US session, which may happen amid positive news on the US election with Democrats taking the upper hand and bulls show no activity at 1.0035, the pressure on the pair will escalate. If so, only a false breakout of the next support level of 0.9977 will generate a buy signal. You can buy EUR/USD immediately at a bounce from the support level of 0.9928 or 0.9887, keeping in mind an upward intraday correction of 30-35 pips.
When to open short positions on EUR/USD:
Sellers have tried really hard today to push the pair below 1.0035. A good option for opening short positions will be a false breakout of the resistance of level 1.0094. It will indicate the presence of large traders in the market, betting on the fall of EUR/USD before the resale of the inflation report tomorrow. In this case, the price may test the 1.0035 level where the moving averages are passing in positive territory. An upward test of this range will give an additional sell signal. Bulls will have to close Stop Loss orders. The euro could slip to 0.9977 where I recommend locking in profits. The pair may tumble lower only because of political news, namely the US midterm election. If EUR/USD rises during the US session and bears show no energy at 1.0094, traders will rush to close short positions. So, the pair may rebound to 1.0136 where the bears will enter the market again. If bears fail to regain the upper hand, it is better to postpone short positions until a false breakout of 1.0182 takes place. You can sell EUR/USD immediately at a bounce from 1.0218, keeping in mind a downward intraday correction of 30-35 pips.
COT report
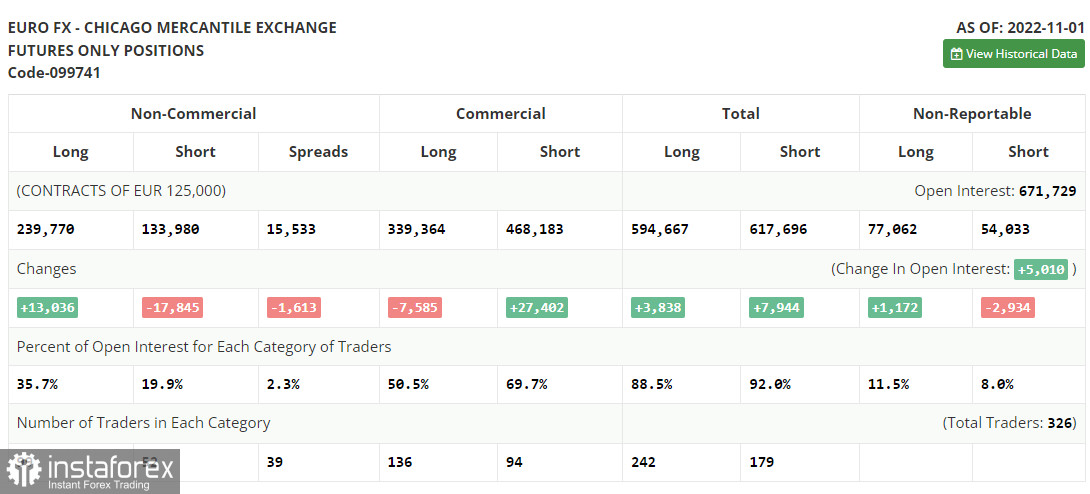
The COT report (Commitment of Traders) for November 1 logged a drop in short positions and an increase in long ones. The US dollar is losing ground against risky assets even though the Fed sticks to a hawkish stance. Many traders expect the central bank to slow down aggressive tightening in the spring of next year. After that, the regulator could move to monetary easing. If so, the euro is highly likely to soar to new highs. This week, the euro could jump amid US inflation data, which the Fed primarily takes into account when making monetary policy decisions. If inflation drops, the US dollar will weaken even more and the euro will be able to consolidate above the parity level. However, the upside potential of the euro is also limited. The ECB has recently announced it could revise its stance in the near future if the eurozone economy continues to shrink at a rapid pace. The COT report revealed that the number of long non-commercial positions increased by 13,036 to 239,770, while the number of short non-commercial positions declined by 17,845 to 133,980. At the end of the week, the total non-commercial net position remained positive and amounted to 105,790 against 74,909. It indicates that investors continue to buy up the cheap euro below the parity level. They are also accumulating long positions betting on long-term recovery. The weekly closing price rose to 0.9918 against 1.0000.
Indicators' signals:
Trading is carried out near the 30 and 50 daily moving averages. It signals that the pair is moving in the sideways channel.
Moving averages
Note: The period and prices of moving averages are considered by the author on the H1 (1-hour) chart and differ from the general definition of the classic daily moving averages on the daily D1 chart.
Bollinger Bands
If EUR/USD declines, the indicator's lower border at 1.0035 will serve as support.
Description of indicators
- Moving average (moving average, determines the current trend by smoothing out volatility and noise). Period 50. It is marked yellow on the chart.
- Moving average (moving average, determines the current trend by smoothing out volatility and noise). Period 30. It is marked green on the chart.
- MACD indicator (Moving Average Convergence/Divergence — convergence/divergence of moving averages) Quick EMA period 12. Slow EMA period to 26. SMA period 9
- Bollinger Bands (Bollinger Bands). Period 20
- Non-commercial speculative traders, such as individual traders, hedge funds, and large institutions that use the futures market for speculative purposes and meet certain requirements.
- Long non-commercial positions represent the total long open position of non-commercial traders.
- Short non-commercial positions represent the total short open position of non-commercial traders.
- Total non-commercial net position is the difference between the short and long positions of non-commercial traders.


