


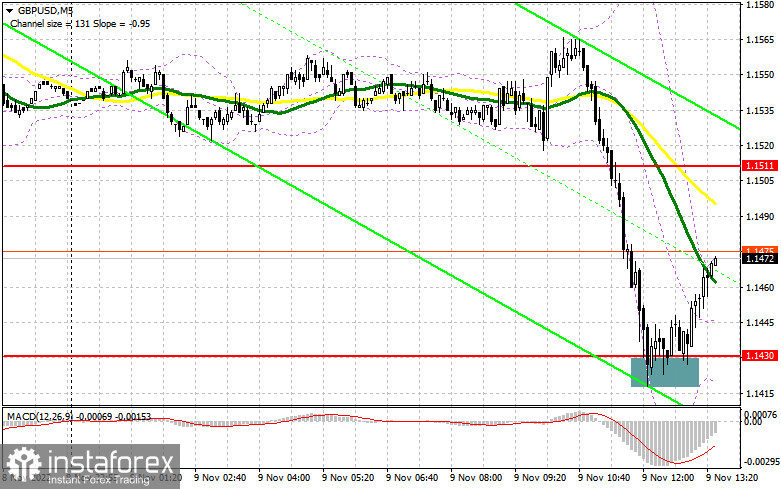
In the morning article, I turned your attention to 1.1430 and advised you to adjust your decisions to this level. Now let's take a look at the 5-minute chart and try to figure out what actually happened. The bears entered the market promptly and pushed the sterling down to 1.1430. A false breakout in that area generated a good entry point for opening long positions as we supposed a further uptrend. By the moment of writing this article, the currency pair had already climbed by more than 40 pips. The technical picture remains the same in the second half of the day.
What is needed to open long positions on GBP/USD
A sharp fall in GBP in the first half of the day again confirmed that the pound sterling is on shaky ground. Any information on the plans of the British government or the Bank of England will trigger extreme volatility. Any negative news could easily knock GBP/USD back down to November lows. So, as I advised you in the morning article, you should be cautious about buying GBP/USD. The economic calendar does not contain any economic data on the US in the second half of the day. Thus, the market will focus on remarks from FOMC members John Williams and Thomas Barkin. The report on US wholesale inventories will make no impact on the market. Hence, it should not be digested carefully.
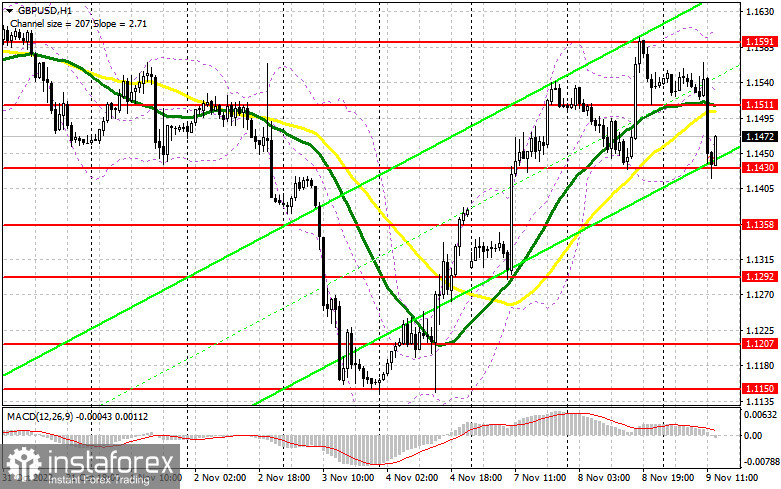
For this reason, it's better to shift focus towards votes in the Congressional midterm elections. The confident victory of the Republicans is certainly bearish for the US dollar. So, the currency pair will move in the sterling's favor. In case, GBP/USD declines lower, I would recommend you delay long positions until the price reached support at 1.1430. Only another false breakout there, like that one I discussed above, will provide a signal to open long positions with the target coinciding with resistance at 1.1511. A breakout of 1.1511, where moving averages are passing, as well as the opposite test downwards will open the door towards 1.1591. This time, moving averages benefit the bears. Then, the price will reach resistance at 1.1666 shortly after. This scenario will wreck the sellers' hope for a correction. In case GPB/USD falls and the sellers lack activity at 1.1423, which is a realistic scenario, the price is likely to hit the low at 1.1358. Therefore, we should not hurry up to enter the market. Only a false breakout at 1.1358 will prove that large market players are present in the market. We could open long positions on GBP/USD immediately at a dip from 1.1292 or from the low of 1.1207, bearing in mind a 30-35-pips intraday correction.
What is needed to open short positions on GBP/USD
The bears are again exerting pressure on the pound sterling, aiming to break support of 1.1430. Below this level, we could see the buyers taking profit before the US CPI data which is due tomorrow. In case the currency pair grows in the second half of the day, I would recommend selling only at a false breakout which will enable a downward move to support at 1.1440. A breakout and the opposite test of this level upwards alongside hawkish comments from the Fed's policymakers will create the market entry point for short positions, aiming to update the low of 1.1358. A more distant lower target is seen at 1.1292 where I recommend profit-taking. Alternatively, if GBP/USD grows in the second half of the day and the bears lack activity at 1.1511, demand for GBP may revive again. In this case, we could rely on the upward move to the high of 1.1591. Only a false breakout of this level will generate the market entry point so that traders could sell the pair before the price reverses downward. Nevertheless, the price could surge to the high of 1.1666 where I recommend selling GBP/USD immediately at a bounce, bearing in mind a 30-35-pips intraday correction.
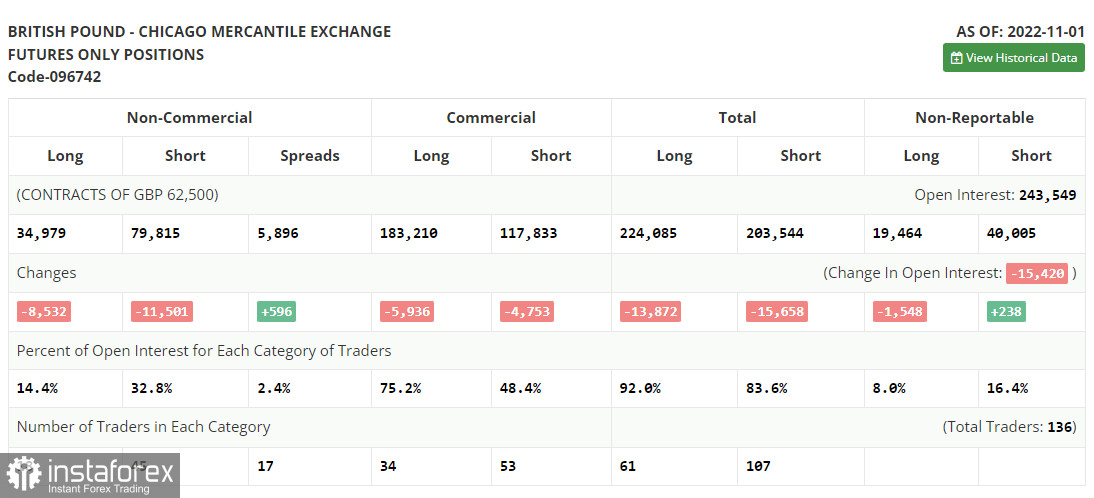
According to the COT report from November 1, we can see contraction in both long and short positions. The most plausible reason was the pending policy meetings of the Federal Reserve and the Bank of England. Following the meetings, USD regained its luster for a while. The current COT report doesn't reflect such policy decisions. The Bank of England raised interest rates in line with expectations. Besides, Governor Andrew Bailey stated that the central bank is ready to ease the pace of further rate hikes not to sacrifice economic growth which has been shrinking rapidly. He also voiced concern about the cost-of-living crisis.
Amid the sharp increase in borrowing costs, the British economy might face another crisis in the housing market. In this context, the Fed's hawkish rhetoric and dovish notes in the Bank of England's rhetoric enables a large sell-off of the pound sterling. Everything changed after the release of the US nonfarm payrolls. The official report revealed a steep decline in employment which serves as a reminder for the US Fed to adopt a more cautious approach to monetary tightening.
The latest COT report reads that the number of long non-commercial positions dropped by 8,532 to 34,979 contracts whereas short non-commercial positions fell by 11,501 to 79,815. As a result, the negative value of non-commercial net positions declined slightly to -44,836 from -47,805 a week ago. GBP/USD closed higher last Friday at 1.1499 against 1.1489 on the previous week.
Indicators' signals:
Trading is carried below the 30 and 50 daily moving averages. It means that the bears are trying to develop a downward correction.
Moving averages
Note: The period and prices of moving averages are considered by the author on the H1 hourly chart and differs from the general definition of the classic daily moving averages on the daily D1 chart.
Bollinger Bands
If GBP/USD grows, the indicator's upper border at 1.1590 will serve as resistance.
Description of indicators
- Moving average (moving average, determines the current trend by smoothing out volatility and noise). Period 50. It is marked yellow on the chart.
- Moving average (moving average, determines the current trend by smoothing out volatility and noise). Period 30. It is marked green on the chart.
- MACD indicator (Moving Average Convergence/Divergence — convergence/divergence of moving averages) Quick EMA period 12. Slow EMA period to 26. SMA period 9
- Bollinger Bands (Bollinger Bands). Period 20
- Non-commercial speculative traders, such as individual traders, hedge funds, and large institutions that use the futures market for speculative purposes and meet certain requirements.
- Long non-commercial positions represent the total long open position of non-commercial traders.
- Short non-commercial positions represent the total short open position of non-commercial traders.
- Total non-commercial net position is the difference between short and long positions of non-commercial traders.


