


Analysis of Thursday's deals:
30M chart of the EUR/USD pair
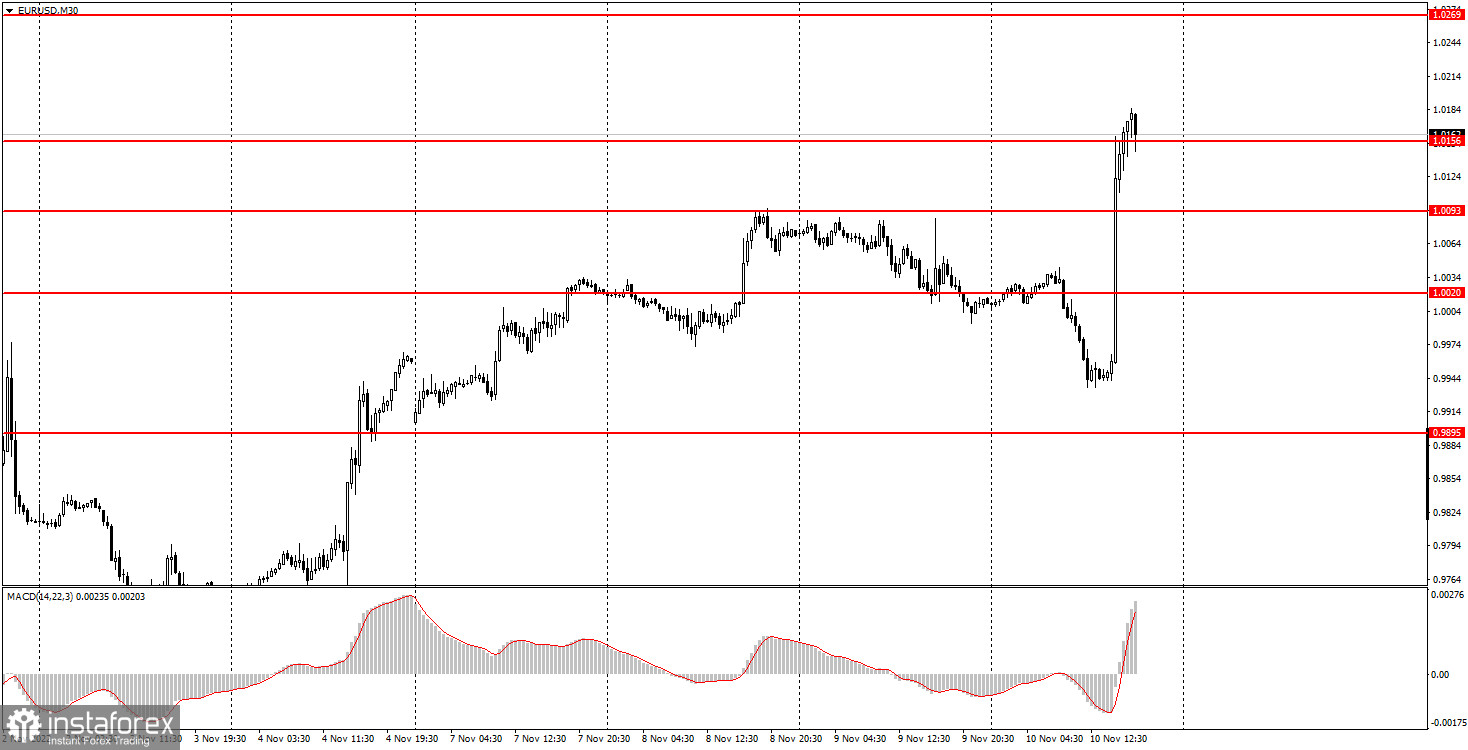
On Thursday, the EUR/USD currency pair continued its downward movement for half of the day, and spent the other half flying into the clouds. Naturally, in the first half of the day we saw a technical movement, and in the second - the market's reaction to the US inflation report. In principle, it makes sense to analyze only this report, since it was followed by a sharp upward reversal of the pair and growth by 200 points in just 15 minutes. So, in October, the consumer price index fell to 7.7% y/y. Let's remind novice traders that the lower inflation falls, the faster it decreases, the less reason the Federal Reserve has to continue to tighten monetary policy. And it is very good for the dollar when the Fed rate increases, thanks to which it has been strengthening in the last 8-9 months. Thus, a sharp drop in inflation means that the Fed will begin to slow down the pace of tightening in the very near future and will sooner refuse to raise the rate altogether. That is why the dollar fell on Thursday. The euro continues to grow, but we still have a huge amount of doubt that it will continue for a long time. Slowly, the number of factors in favor of the euro's growth is growing, so you can count on a long-term upward trend. But proceed with caution.
5M chart of the EUR/USD pair
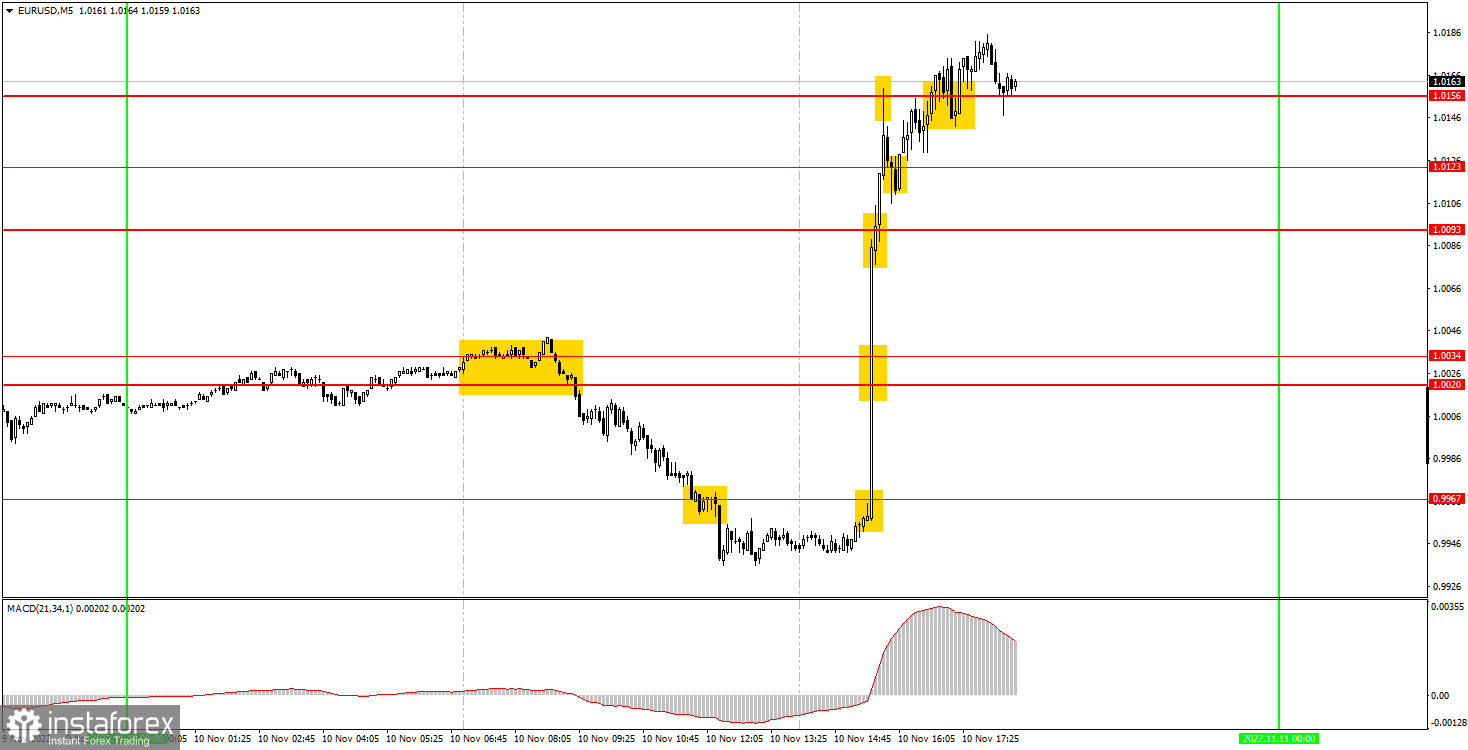
On the 5-minute timeframe, you can even better see that the price soared up by 200 points in just 15 minutes. Naturally, it was impossible to work out all the signals that were formed during these 15 minutes. Also, it was not necessary to work out all the signals that were formed after moving up by 2 figures. It remains only to figure out how to trade in the European trading session. The first sell signal was formed in the area of 1.0020-1.0034. The price managed to get to the nearest target level of 0.9967 and even overcome it. Therefore, the position should have been closed manually half an hour or an hour before the inflation report was released. As a result, the profit on it amounted to 60 points. Although the afternoon movement was not caught, the day still turned out to be successful.
How to trade on Friday:
The pair continues to move up on the 30-minute timeframe, but there is a feeling that it will not last long. We have formed a new ascending trend line, and by settling below it, it will be possible to determine when this movement will end. Naturally, the dollar fell solely on the basis of macroeconomic statistics. The euro will no longer have such luck on Friday. On the 5-minute TF, it is recommended to trade at the levels of 0.9967, 1.0020-1.0034, 1.0093, 1.0123, 1.0156, 1.0221, 1.0269-1.0277, 1.0354. When passing 15 points in the right direction, you should set Stop Loss to breakeven. The European Union will again not have a single significant report or other event, and in the US only the consumer sentiment index from the University of Michigan will be published.
Basic rules of the trading system:
1) The signal strength is calculated by the time it took to form the signal (bounce or overcome the level). The less time it took, the stronger the signal.
2) If two or more positions were opened near a certain level based on false signals (which did not trigger Take Profit or the nearest target level), then all subsequent signals from this level should be ignored.
3) In a flat, any pair can form a lot of false signals or not form them at all. But in any case, at the first signs of a flat, it is better to stop trading.
4) Trade positions are opened in the time period between the beginning of the European session and until the middle of the US one, when all positions must be closed manually.
5) On the 30-minute TF, using signals from the MACD indicator, you can trade only if there is good volatility and a trend, which is confirmed by a trend line or a trend channel.
6) If two levels are located too close to each other (from 5 to 15 points), then they should be considered as an area of support or resistance.
On the chart:
Support and Resistance Levels are the Levels that serve as targets when buying or selling the pair. You can place Take Profit near these levels.
Red lines are the channels or trend lines that display the current trend and show in which direction it is better to trade now.
The MACD indicator (14,22,3) consists of a histogram and a signal line. When they cross, this is a signal to enter the market. It is recommended to use this indicator in combination with trend lines (channels and trend lines).
Important speeches and reports (always contained in the news calendar) can greatly influence the movement of a currency pair. Therefore, during their exit, it is recommended to trade as carefully as possible or exit the market in order to avoid a sharp price reversal against the previous movement.
Beginners on Forex should remember that not every single trade has to be profitable. The development of a clear strategy and money management are the key to success in trading over a long period of time.


