


Analysis of Monday's deals:
30M chart of the GBP/USD pair
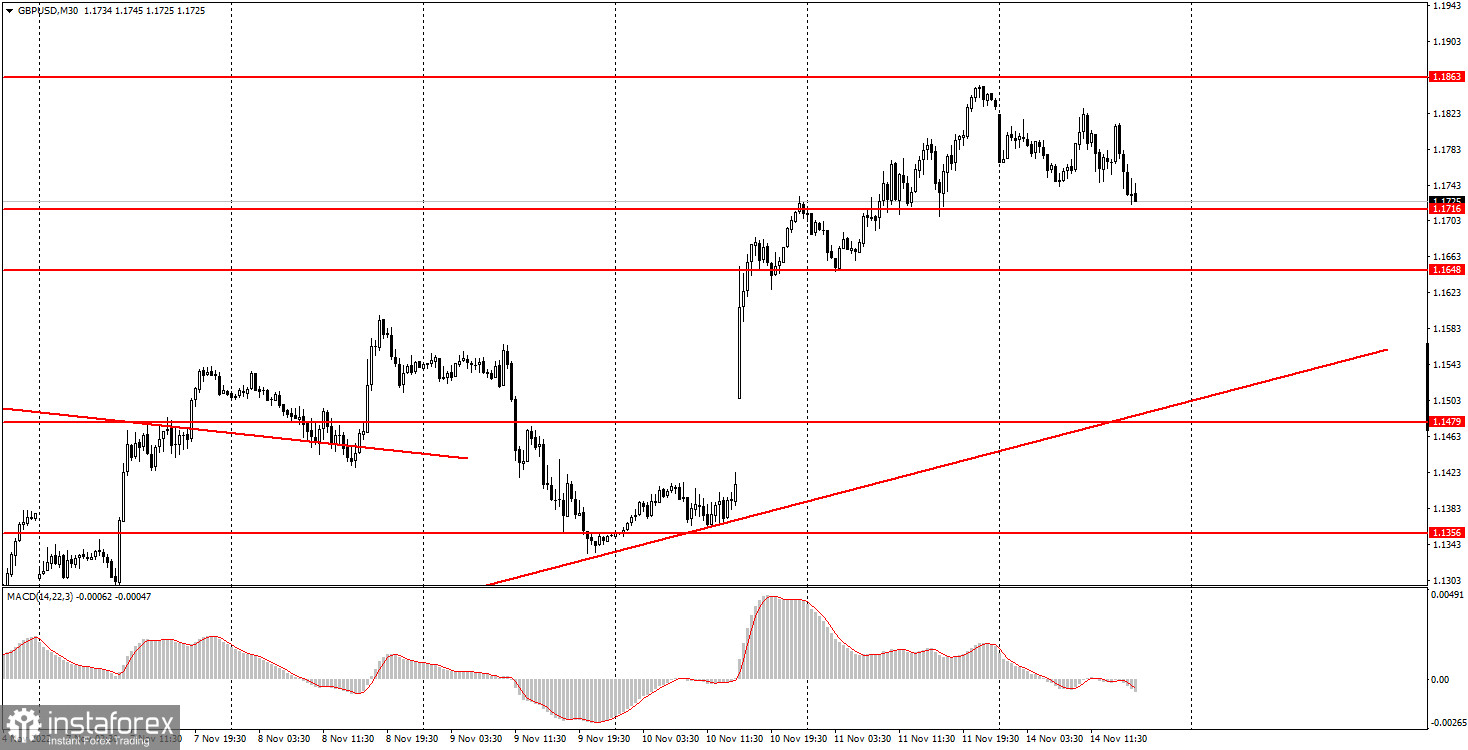
The GBP/USD pair corrected slightly on Monday, however, the downward movement was frankly weak and not in proportion with the growth that was observed on Thursday and Friday. The upward trend remains relevant, as evidenced by the rising trendline. This week we expect a correction, as we believe that the dollar's recent fall was not entirely logical and justified. Since there will be little fundamental and macroeconomic background this week, this is almost an ideal time to correct the pair. There was not a single significant event in either the UK or the US on Monday. In the US, all the news is now connected with the elections to the Congress, where the Republicans win in the Lower House, and the Democrats win in the Upper House. In principle, if everything remains like this, then nothing terrible will happen for the Democrats, who will keep in their hands the two most important steps of power out of the three possible. For the Republicans, this election will be a defeat, even if they win the House of Representatives.
5M chart of the GBP/USD pair
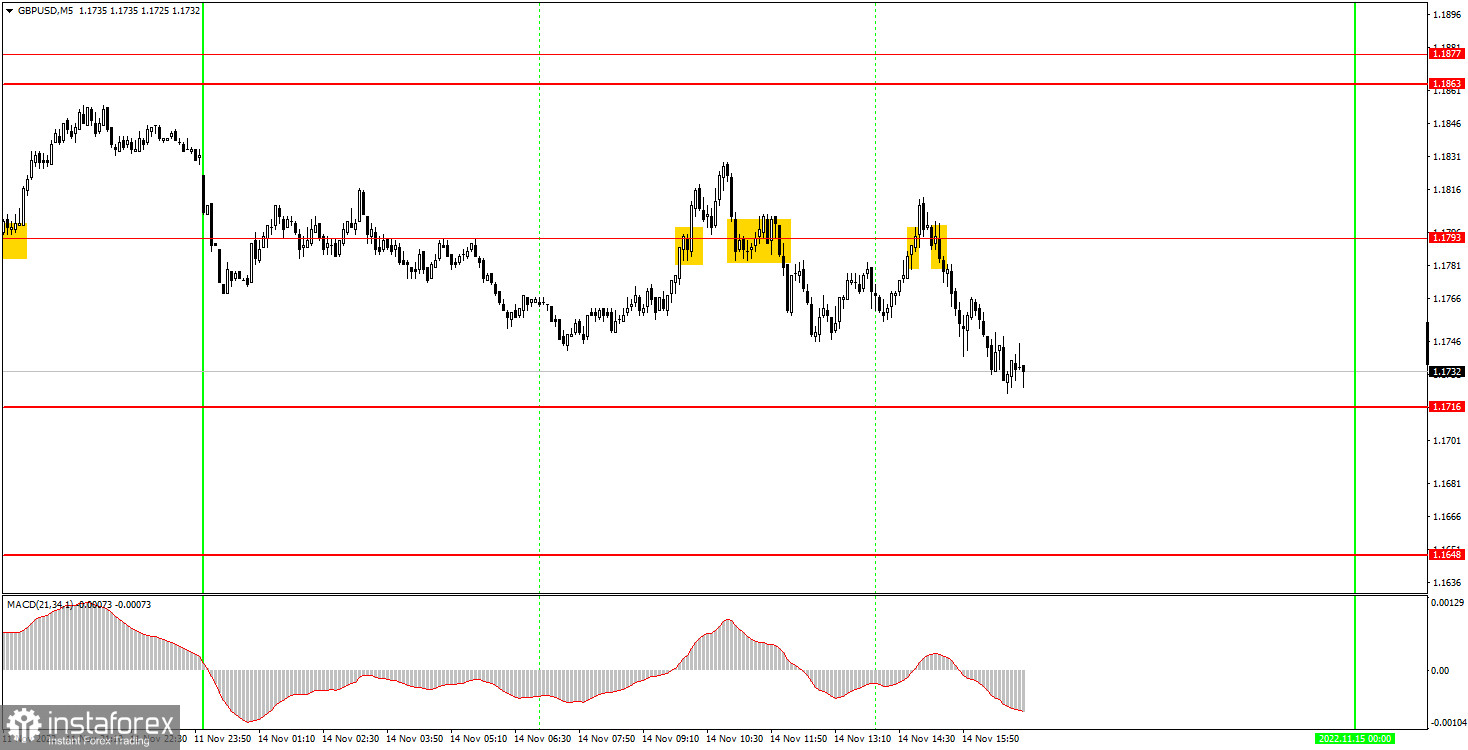
The movement on the 5-minute chart was not the best, as the price changed direction several times a day. The level of 1.1793 stood on the way several times, and several false signals were formed around it. Let's figure it out. The first buy signal immediately turned out to be false. By and large, all four signals turned out to be false, since the target level was never reached. Therefore, novice traders could work out only the first two signals. After the first one, the price went up with grief in half 20 points, which was enough to set Stop Loss to breakeven. After the second signal to sell, the pair went down 33 points, which was also enough to set Stop Loss to breakeven. Therefore, neither profit nor loss was received on both transactions. The last two signals should not have been worked out.
How to trade on Tuesday:
The GBP/USD pair maintains an upward trend on the 30-minute chart, which is now supported by an ascending trend line. Although we still don't see a good reason to show such strong growth, the market can move regardless of our opinion. So we definitely have an upward trend at this time, but we expect a significant downtrend this week. On the 5-minute TF, it is recommended to trade at the levels of 1.1550, 1.1608, 1.1648, 1.1716, 1.1793, 1.1863-1.1877, 1.1967, 1.1994. When the price passes after opening a position in the right direction for 20 points, Stop Loss should be set to breakeven. The UK will publish data on unemployment and wages on Tuesday. These are not the most important reports, but a certain reaction to them may follow. There is nothing interesting in America.
Basic rules of the trading system:
1) The signal strength is calculated by the time it took to form the signal (bounce or overcome the level). The less time it took, the stronger the signal.
2) If two or more positions were opened near a certain level based on false signals (which did not trigger Take Profit or the nearest target level), then all subsequent signals from this level should be ignored.
3) In a flat, any pair can form a lot of false signals or not form them at all. But in any case, at the first signs of a flat, it is better to stop trading.
4) Trade positions are opened in the time period between the beginning of the European session and until the middle of the US one, when all positions must be closed manually.
5) On the 30-minute TF, using signals from the MACD indicator, you can trade only if there is good volatility and a trend, which is confirmed by a trend line or a trend channel.
6) If two levels are located too close to each other (from 5 to 15 points), then they should be considered as an area of support or resistance.
On the chart:
Support and Resistance Levels are the Levels that serve as targets when buying or selling the pair. You can place Take Profit near these levels.
Red lines are the channels or trend lines that display the current trend and show in which direction it is better to trade now.
The MACD indicator (14,22,3) consists of a histogram and a signal line. When they cross, this is a signal to enter the market. It is recommended to use this indicator in combination with trend lines (channels and trend lines).
Important speeches and reports (always contained in the news calendar) can greatly influence the movement of a currency pair. Therefore, during their exit, it is recommended to trade as carefully as possible or exit the market in order to avoid a sharp price reversal against the previous movement.
Beginners on Forex should remember that not every single trade has to be profitable. The development of a clear strategy and money management are the key to success in trading over a long period of time.


