


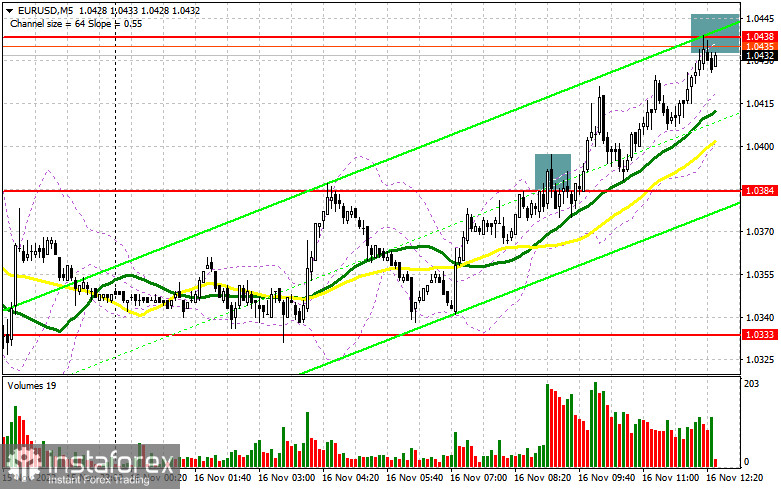
In the morning article, I turned your attention to 1.0384 and recommended making decisions with this level in focus. Now, let's look at the 5-minute chart and figure out what actually happened. The pair reached this level quite quickly in the morning. After that, the bulls left the market, which led to a false breakout and a sell signal. However, the pressure on the pair did not return. The news that the missiles that hit the Polish territory were not from Russia calmed investors. So, there was no sell-off of risky assets. Therefore, EUR/USD rose to 1.0438. Bulls and bears are likely to tussle for this level in the afternoon.
When to open long positions on EUR/USD:
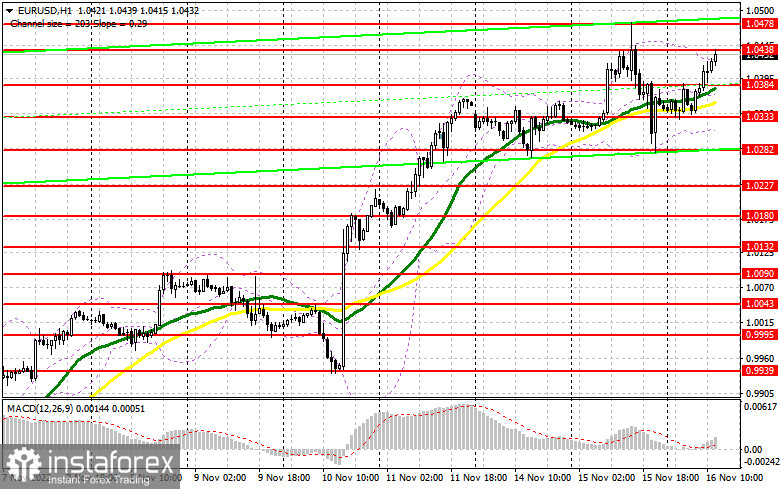
Given that the economic calendar remained empty in the morning, traders were largely focused on geopolitical news. The euro managed to climb to 1.0440 following relatively positive news about the missile. However, I would not be so optimistic about the long-term bullish scenario. The US will soon reveal retail sales and industrial production data. If these indicators advance, the US dollar will surely regain ground. If so, there could be a significant downward correction in EUR/USD. An increase in retail sales will affect inflation, which has just begun to decline. It could force the Fed to stick to aggressive tightening. John Williams and Christopher Waller will deliver speeches. They could also foster the growth of the greenback. In the current conditions, it would be appropriate to open long positions after a false breakout of the nearest support level of 1.0384, which acted as resistance in the morning. It will generate a buy signal, facilitating the uptrend. The pair is likely to return to the resistance level of 1.0438. Currently, bulls and bears are trying to take control of this level. A breakout and a downward retest of this level will open the way to 1.0478. Bulls are likely to assert strength. In this case, a large upward correction to 1.0525 may take place. At this level, I recommend locking in profits. If EUR/USD declines during the US session and bulls show no activity at 1.0384, the pressure on the euro will return. Traders will rush to close long positions. So, the pair could lose momentum. In this case, it is better to open long positions only after a false breakout of the support level of 1.0333. The moving averages are passing above this level. You can buy EUR/USD immediately at a bounce from 1.0282 or 1.0227, keeping in mind an upward intraday correction of 30-35 pips.
When to open short positions on EUR/USD:
The sellers failed to push the pair to the target level. Now, they are unwilling to regain control. Sellers are counting on strong US economic reports. In the afternoon, bears need to try really hard to push the pair to the resistance level of 1.0438. A false breakout of this level will give a sell signal. A similar situation occurred yesterday when the euro performed a downward correction before the opening of the American session. In this case, the pair is highly likely to decline and retest 1.0384. An upward retest of this level will generate an additional sell signal. Bulls will have to close Stop Loss orders. The euro may slide to 1.0333 where I recommend locking in profits. If EUR/USD rises during the US session and bears show no energy at 1.0438, the bullish trend will persist. It will open the way to a monthly high of 1.0478. If bears fail to take the upper hand at that level, it is better to postpone short positions until a breakout of 1.0525 takes place. You can sell EUR/USD immediately at a bounce from1.0568, keeping in mind a downward intraday correction of 30-35 pips.
COT report
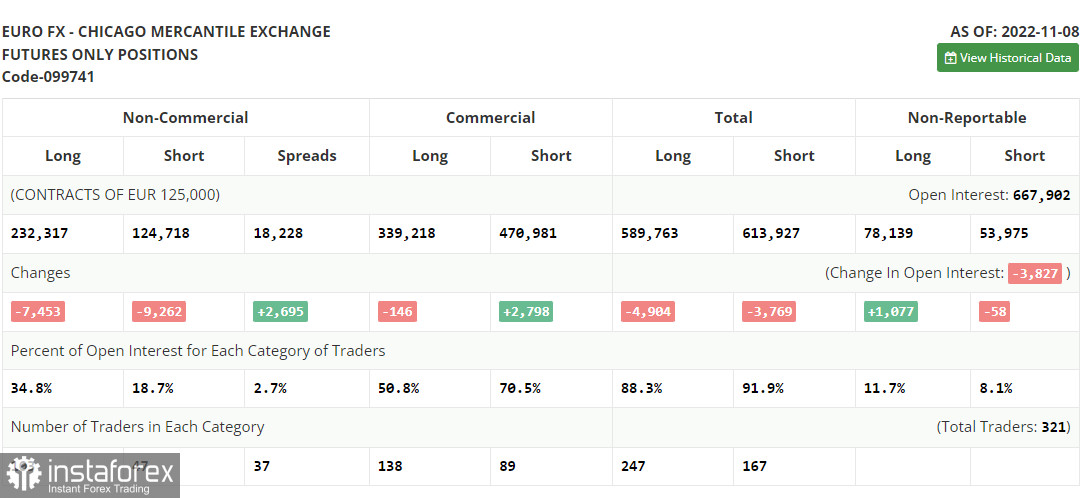
According to the COT report from November 8, the number of both short and long positions dropped. However, we cannot fully rely on the data since it does not reflect the market situation amid the US inflation figures. The fact is that the US Fed will continue to increase the key interest rate despite a slowdown in consumer price growth. In December, the regulator may raise the benchmark rate by 0.5% or 0.75%. Meanwhile, demand for risk assets, including the euro, has increased. The key reason is a slower pace of the key interest rate hike by the Fed and a further rise in the ECB's interest rate. More and more European politicians are considering a more aggressive approach since it is impossible to cope with surging inflation using moderate measures. However, if the eurozone economy continues to contract that fast, the ECB will hardly switch to a more hawkish stance. This, in turn, will cap the pair's upward potential in the midterm. According to the COT report, the number of long non-commercial positions dropped by 7,453 to 232,317, while the number of short non-commercial positions declined by 9,262 to 124,718. At the end of the week, the total non-commercial net position remained positive at 107,599 against 105,790. This indicates that investors continue benefiting from the situation and buying the cheap euro below parity, as well as accumulating long positions, expecting the end of the crisis. The weekly closing price rose to 1.0104 from 0.9918.
Indicators' signals:
Trading is carried out above the 30 and 50 daily moving averages, indicating a further rise in the euro.
Moving averages
Note: The period and prices of moving averages are considered by the author on the H1 (1-hour) chart and differ from the general definition of the classic daily moving averages on the daily D1 chart.
Bollinger Bands
If EUR/USD moves up, the indicator's upper border at 1.0333 will serve as resistance.
Description of indicators
- Moving average (moving average, determines the current trend by smoothing out volatility and noise). Period 50. It is marked yellow on the chart.
- Moving average (moving average, determines the current trend by smoothing out volatility and noise). Period 30. It is marked green on the chart.
- MACD indicator (Moving Average Convergence/Divergence — convergence/divergence of moving averages) Quick EMA period 12. Slow EMA period to 26. SMA period 9
- Bollinger Bands (Bollinger Bands). Period 20
- Non-commercial speculative traders, such as individual traders, hedge funds, and large institutions that use the futures market for speculative purposes and meet certain requirements.
- Long non-commercial positions represent the total long open position of non-commercial traders.
- Short non-commercial positions represent the total short open position of non-commercial traders.
- Total non-commercial net position is the difference between the short and long positions of non-commercial traders.


