


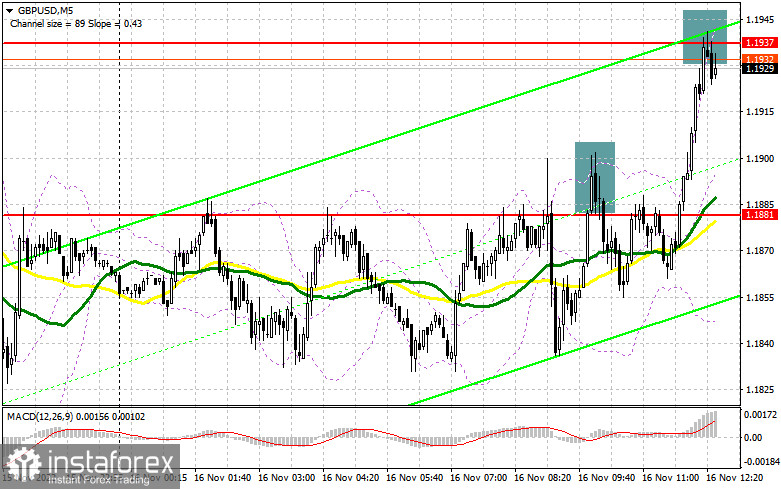
In my morning review, I turned your attention to 1.1881 and recommended making trading decisions on the market entry. Now let's take a look at the 5-minute chart and try to figure out what actually happened. The bulls easily pushed the price above 1.1881 in the first half of the day but the price failed to settle at highs. So, the chart generated a sell signal. Importantly, the UK CPI report showed another jump in inflation above 11% on year in October. Therefore, the bulls carried on buying the sterling, betting on further sharp rate hikes by the Bank of England. As a result, GBP/USD was not able to make a proper downward correction. At the moment of writing this article, the bears are fighting for 1.1937, reckoning a false breakout during the downward move.
What is needed to open long positions on GBP/USD
The actual UK CPI was stronger than the 10.9% growth predicted by the central bank and above the consensus of 10.7%. The Bureau of National Statistics reported on Wednesday that sky-high food and energy prices were to blame for the higher-than-expected CPI. This enables a conclusion that the Bank of England will have to forge ahead with rate hikes. Indeed, taking a pause in monetary tightening, it runs the risk of losing control over inflation. Once it settles firmly in the economy, the country will face a serious economic downturn in the years ahead.
As for the economic calendar for the US, investors are anticipating data on retail sales and industrial production. An increase in both metrics is likely to invite the dollar bulls back to the market. This will cause a considerable downward correction in GBP/USD. Growth in retail sales will trigger further inflation acceleration. Recently, inflation ebbed away a bit in the US. The Federal Reserve might go ahead with its aggressive rate hikes.
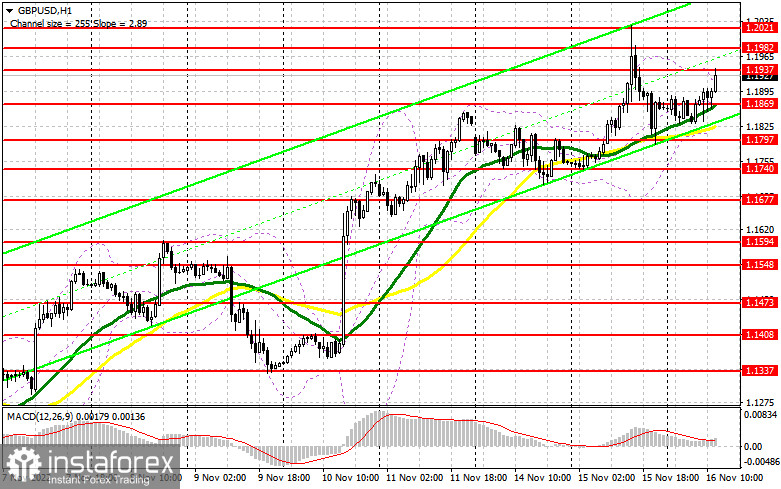
To sum up, in case of a GBP decline, the reasonable trading plan would be opening long positions following a false breakout at around the new support at 1.1869 formed in the first half of the day. Moving averages benefitting the bulls are a bit lower. This will generate a buy signal with the aim of price returning and updating the resistance of 1.1937, where the sellers have asserted themselves today. A break and downward test of 1.1937 will allow building a more powerful trend with the prospect of a breakthrough to 1.1982. The most distant target will be this month's high of 1.2021, where I recommend taking profits. If the bulls do not cope with the tasks set in the afternoon and miss 1.1869, a small profit-taking will take place. The currency pair will come under selling pressure again which will open the way to 1.1797. In this case, I advise you to buy there only on a false breakdown. I recommend opening long positions on GBP/USD immediately for a rebound from 1.1740, or even lower - around 1.1677, bearing in mind a 30-35-pips correction within the day.What is needed to open short positions on GBP/USD
Sellers fight back as best they can, but so far they can't offer anything serious. Apparently, the bears will rely on strong fundamental data on the US. At the moment, the bears need to think about how to defend the resistance of 1.1937, which has already been tested. Only the next false breakout there will be a signal to open short positions against the trend, pushing the pound back to 1.1869 - the support formed in the first half of the day. A break and test of 1.1869, strong US GDP data, and hawkish comments by Fed officials will all provide an entry point with short positions, relying on a return to 1.1797. The lowest target will be the area of 1.1740, where I recommend taking profits. With the scenario of GBP/USD moving up and the absence of bears at 1.1937, and everything is going to this, the bulls will enter the market, counting on a new wave of growth and a further uptrend. This will push GBP/USD up to the 1.1982 area. Only a false break at this level will provide an entry point into short positions with the aim of moving down. If there is no activity there, I advise you to sell GBP/USD immediately from 1.2021, counting on the pair's slide by 30-35 points within a day.
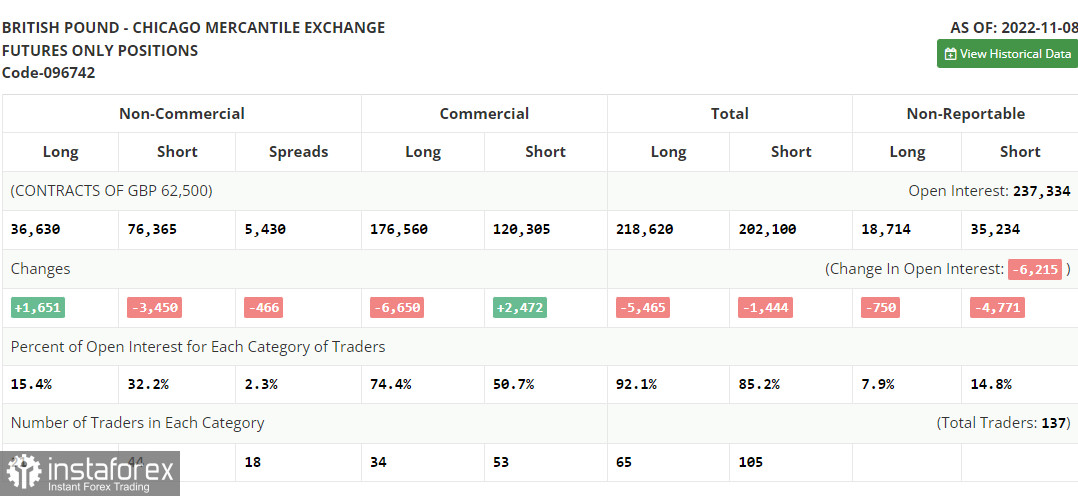
The COT report (Commitment of Traders) for November 8 logs a decrease in short positions and an increase in long ones. The results of the Bank of England meeting influenced the balance of trading forces: even though the regulator no longer plans to pursue a super-aggressive policy, demand for an undervalued pound is still buoyant, as GBP finds support from the fact that inflation in the US was lower than economists predicted. How long this will help the bulls to hold GBP at highs is a big question. Troubles in the UK economy confirmed by the recent GDP data continue to put pressure on the government and on the Bank of England, which slows down the economy even more with its rate hikes. In the near future, reports on the labor market will be released. If we see serious negative changes there, the British pound may respond with a strong fall. The latest COT report indicated that long non-commercial positions rose by 1,651 to 36,630, while short non-commercial positions decreased by 3,450 to 76,365, which led to a further decline in the negative non-commercial net position to -39,735 against -44,836 a week earlier. GBP/USD closed last week higher at 1.1549 against 1.1499 in the previous week.
Indicators' signals:
Trading is carried out above the 30 and 50 daily moving averages. It indicates a further growth of the sterling.
Moving averages
Note: The period and prices of moving averages are considered by the author on the H1 (1-hour) chart and differ from the general definition of the classic daily moving averages on the daily D1 chart.
Bollinger Bands
If GBP/USD declines, the indicator's lower border at 1.1830 will serve as support.
Description of indicators
- Moving average (moving average, determines the current trend by smoothing out volatility and noise). Period 50. It is marked yellow on the chart.
- Moving average (moving average, determines the current trend by smoothing out volatility and noise). Period 30. It is marked green on the chart.
- MACD indicator (Moving Average Convergence/Divergence — convergence/divergence of moving averages) Quick EMA period 12. Slow EMA period to 26. SMA period 9
- Bollinger Bands (Bollinger Bands). Period 20
- Non-commercial speculative traders, such as individual traders, hedge funds, and large institutions that use the futures market for speculative purposes and meet certain requirements.
- Long non-commercial positions represent the total long open position of non-commercial traders.
- Short non-commercial positions represent the total short open position of non-commercial traders.
- Total non-commercial net position is the difference between short and long positions of non-commercial traders.


