


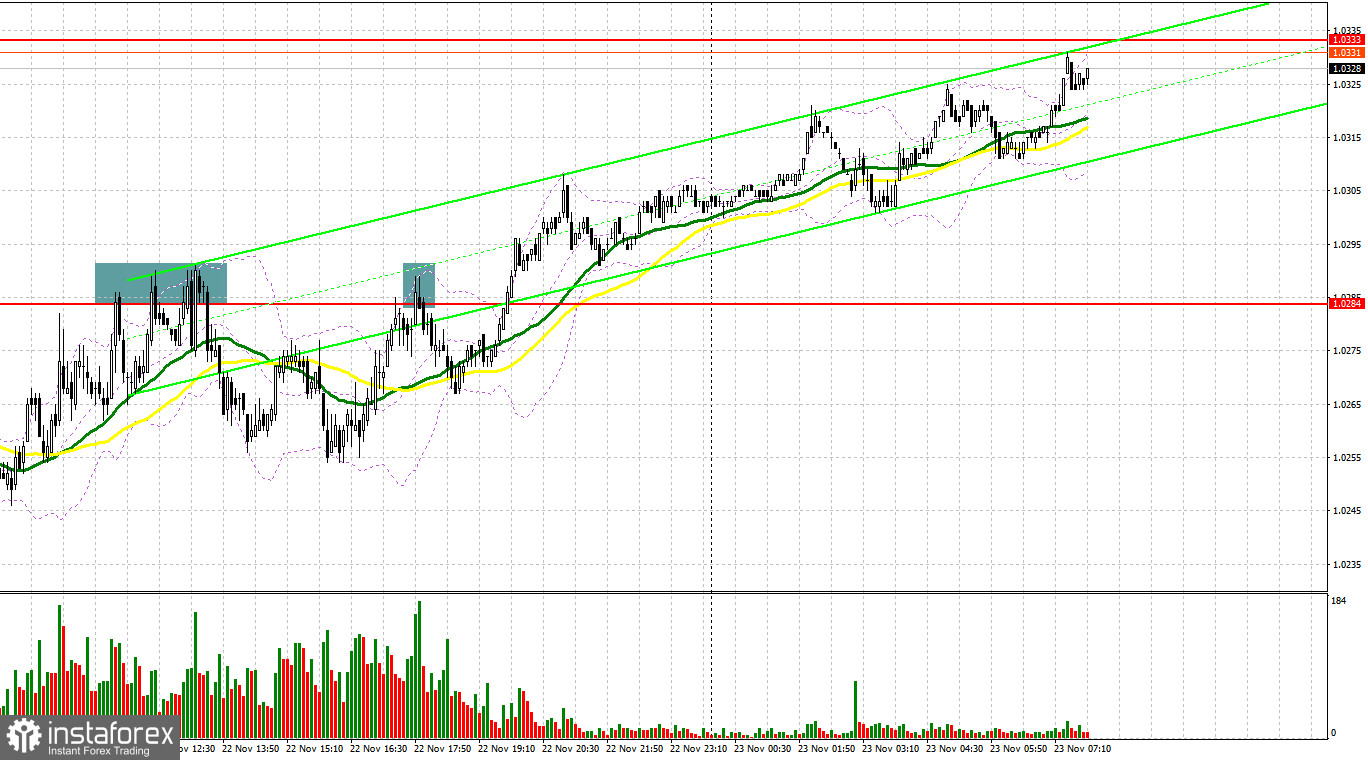
Yesterday, traders received several signals to enter the market. Let us take a look at the 5-minute chart to figure out what happened. Earlier, I asked you to pay attention to the level of 1.0284 to decide when to enter the market. A rise and false breakout near this level led to a sell signal. As a result, in the second part of the day, traders received another several sell signals, which led to the euro's sell-off. In this light, traders earned more than 30 pips.
Conditions for opening long positions on EUR/USD:
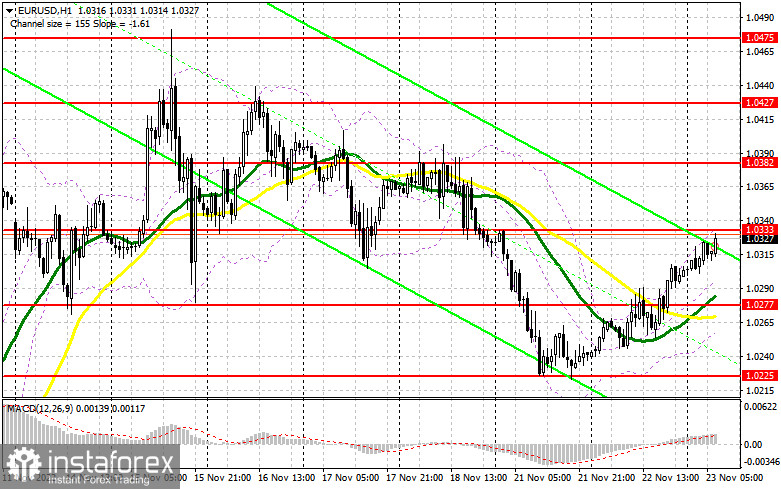
Strong data from the eurozone and comments provided by the Fed's representatives allowed the euro to recoup some losses after bears failed to push the price to its weekly lows. Some Fed officials said that it was high time to switch to a less aggressive approach to monetary policy tightening. Today, in the first part of the day, we may see a lot of important macroeconomic reports that will have a negative influence on the euro if they turn out to be weak. Thus, the eurozone is going to disclose its manufacturing, services, and composite PMI reports. Under the current conditions, it will be better to buy the euro amid its fall caused by the data. The target is located near the support level of 1.0277, where there are bullish MAs. A false breakout in this area will prove the presence of big traders in the market, who are betting on a further rise in the euro. Thus, the currency will have a chance to return to 1.0333. If the price breaks and downwardly tests this area, the euro/dollar pair may jump to 1.0382. If the pair breaks 1.0427, this will affect bears' stop orders and give an additional buy signal with the target at the monthly high of 1.0475. Traders should lock in profits at this level. This will intensify the bullish trend. If the euro/dollar pair declines and buyers fail to protect 1.0277, pressure on the currency will increase. In this case, traders will shift their attention to the data that will be published in the second part of the day. A breakout of 1.0277 will cause a decline to the support level of 1.0225. There, traders may go long only after a false breakout. It is also possible to go long just after a bounce off 1.0180 or lower – from 1.0132, expecting an increase of 30-35 pips within the day.
Conditions for opening short positions on EUR/USD:
It is obvious that bears are trying to return to the market, but announcements made by the Fed's representatives are preventing them from doing this. Now, they should protect the level of 1.0333. If the price breaks this level, bulls will gain control over the market. A false breakout of this level will give a perfect entry point, thus allowing sellers to push the price to the support level of 1.0277 formed yesterday. The price may settle below this level amid weak data from Germany and France, which may prove a slowdown in economic growth. An upward test of 1.0277 will give a sell signal, which may affect bulls' stop orders and lead to a deeper drop to 1.0225. There, buyers are likely to become active and start recouping losses. The farthest target is located at 1.0180, where it is recommended to lock in profits. If the euro/dollar pair increases during the European session and bears fail to protect 1.0333, demand for the pair will rise, thus causing a further increase above 1.0382. In the event of this, sellers should remain cautious. It is better to go short after a false breakout. They may also open sell orders just after a rebound from the high of 1.0427 or higher - from 1.0475, expecting a decline of 30-35 pips.
COT report
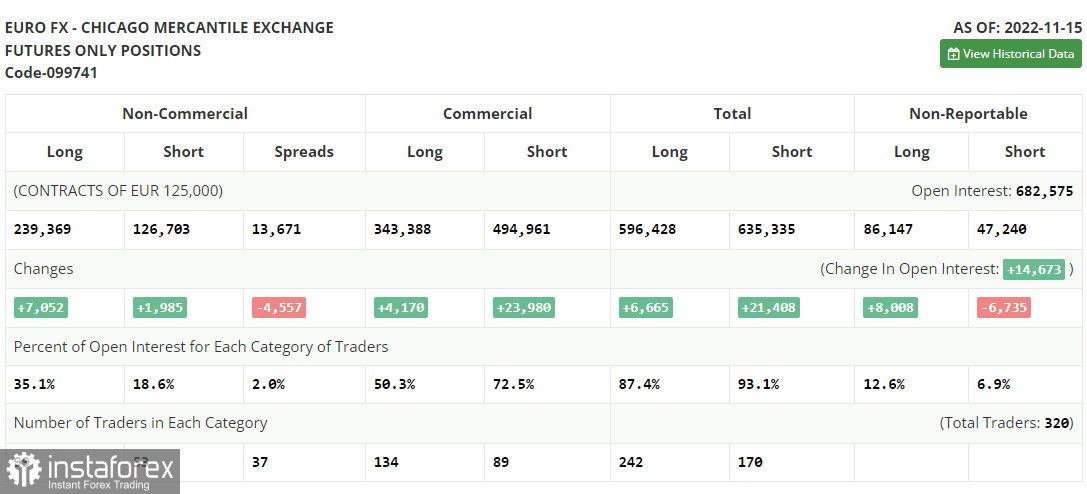
According to the COT report from November 15, the number of both long and short positions increased. There are more and more rumors that the Fed may switch to a less aggressive policy as early as December. However, such assumptions do not correspond to the recent rise in US retail sales in October. The data exceeded forecasts, pointing to the fact that inflation is likely to go on rising. That is why traders should be very cautious when analyzing the recent CPI report, which unveiled slower growth. It is highly possible that the Federal Reserve will remain stuck to its current policy, thus continuing to raise the benchmark rate. Demand for risk assets, including the euro, has increased. Judging by the recent data from the eurozone, especially the GDP growth rate, the euro/dollar pair is unlikely to show another jump until the end of the year. The COT report unveiled that the number of long non-commercial positions increased by 7,052 to 239,369, whereas the number of short non-commercial positions advanced by 1,985 to 126,703. At the end of the week, the total non-commercial net position remained positive at 112,666 compared to 107,599. This indicates that investors continue benefiting from the situation and buying the cheap euro below parity, as well as accumulating long positions, expecting the end of the crisis. The weekly closing price rose to 1.0390 against 1.0104.
Signals of indicators:
Moving Averages
Trading is performed above 30- and 50-day moving averages, which points to a further rise in the euro.
Note: The period and prices of moving averages are considered by the author on the one-hour chart which differs from the general definition of the classic daily moving averages on the daily chart.
Bollinger Bands
If the euro rise, the upper limit of the indicator located at 1.0333 will act as resistance. If the pair drops, support will be situated at the lower limit of the indicator – at 1.0260.
Description of indicators
- Moving average (moving average, determines the current trend by smoothing volatility and noise). The period is 50. It is marked in yellow on the chart.
- Moving average (moving average, determines the current trend by smoothing volatility and noise). The period is 30. It is marked in green on the graph.
- MACD indicator (Moving Average Convergence/Divergence - convergence/divergence of moving averages). A fast EMA period is 12. A slow EMA period is 26. The SMA period is 9.
- Bollinger Bands. The period is 20.
- Non-profit speculative traders are individual traders, hedge funds, and large institutions that use the futures market for speculative purposes and meet certain requirements.
- Long non-commercial positions are the total number of long positions opened by non-commercial traders.
- Short non-commercial positions are the total number of short positions opened by non-commercial traders.
- The total non-commercial net position is a difference in the number of short and long positions opened by non-commercial traders.


