


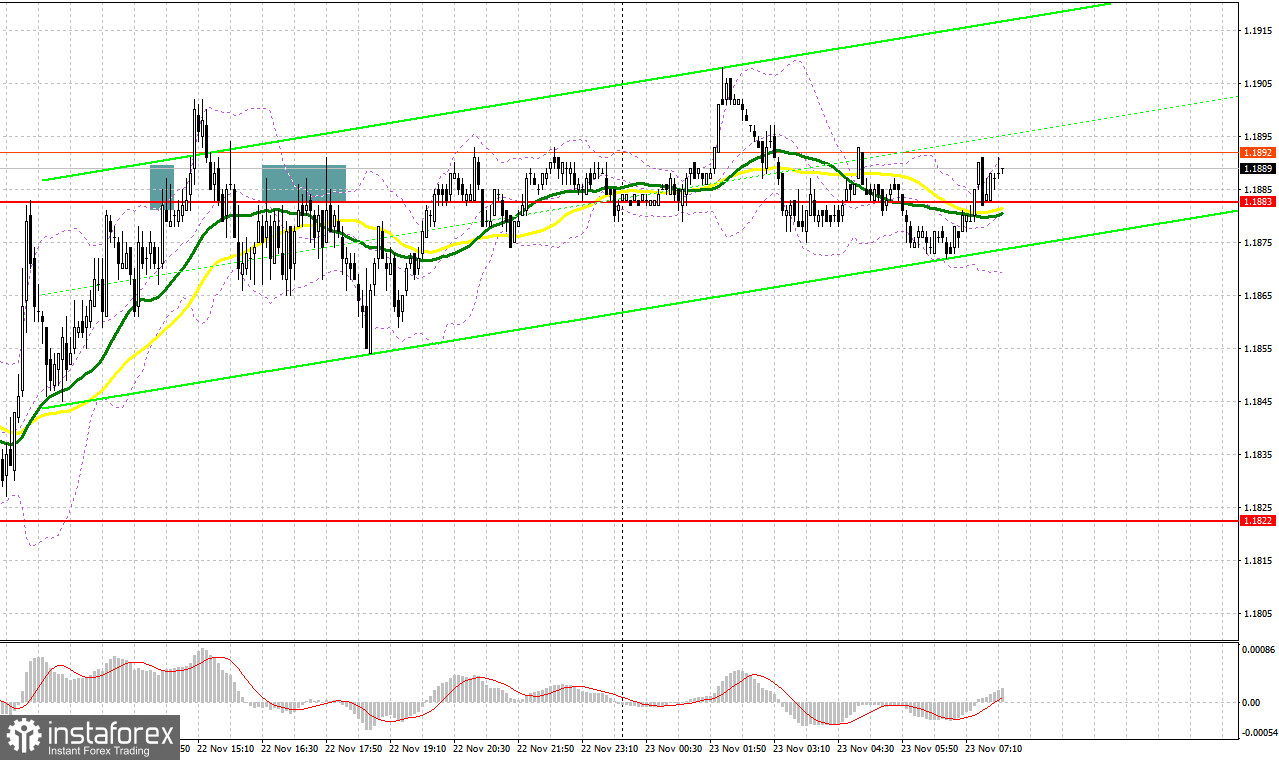
Yesterday, there were several entry points. Now, let's look at the 5-minute chart and figure out what actually happened. In the morning article, I turned your attention to the support and resistance levels. The pair failed to reach them. In the morning yesterday, the pound sterling remained in the sideways range due to low volatility. Even the speech of the BoE policymaker did not stir market swings. In the afternoon, the bears managed to protect 1.1883. It gave a sell signal. However, the pair did not drop lower. Traders had to close Stop Loss orders due to a breakout and a rise above 1.1883. Only in the middle of the American session, after returning to 1.1883, there was another sell signal as the pair performed an upward retest. The price moved down by more than 30 pips. Thus, traders were able to offset losses and earn a small profit.
When to open long positions on GBP/USD:
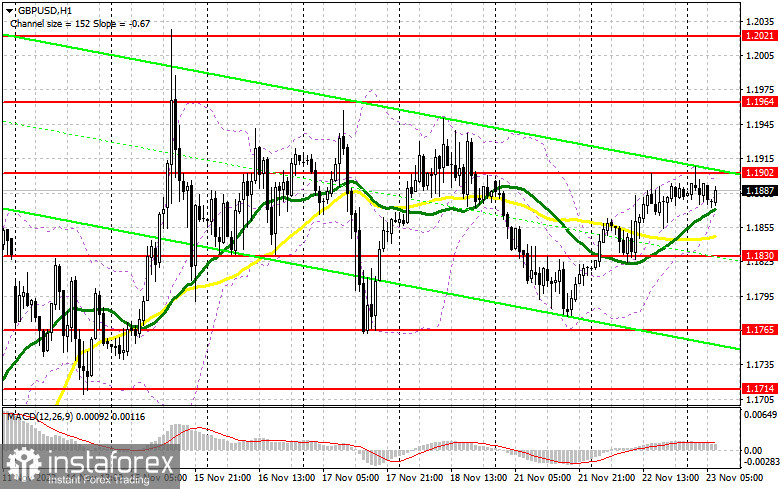
In the European session, the pound sterling may lack drivers for further growth as economic reports are likely to be weak. The UK Manufacturing and Services PMI Indices are on tap. Analysts expect rather downbeat results. If their forecasts come true, it will signal a slowdown in economic expansion. However, this news will hardly surprise anyone. BoE policymakers who have recently delivered speeches have also made rather gloomy statements. Today, BoE MPC Member Huw Pill is scheduled to make a speech. His remarks may once again confirm that the UK economy is rapidly shrinking. If so, the pound sterling is highly likely to face strong bearish pressure. If the pound/dollar pair drops, it would be wise to open long positions after a false breakout of the support level of 1.1830. Only after that, there could be a buy signal with the prospect of a rise to the resistance level near the 19th level. Yesterday, it failed to lift above this level. The main task of the bulls today is to regain control of this level. It will be impossible to continue the uptrend without moving above this level. The pair is sure to advance above this level provided that there will be a breakout and a downward retest of this level. BoE members' hawkish statements and positive economic reports will also help bulls push the pair higher. An increase above 1.1902 will open the way to 1.1964. A more distant target will be the 1.2021 level where I recommend locking in profits. If the bulls fail to push the pair to 1.1830, which may happen in the first half of the day, the pressure will escalate again. The bears will return to the market. In this case, it is better to open long positions only if a breakout of 1.1765 and 1.1714 takes place. You could buy GBP/USD immediately at a bounce from 1.1650 or 1.1594, keeping in mind an upward intraday correction of 30-35.
When to open short positions on GBP/USD:
Sellers no longer have such a significant advantage as they had at the start of the week. Today, they could regain the upper hand if macros stats turn out to be worse than forecasts. A false breakout of 1.1902, similar to the one I have mentioned above, will provide an excellent sell signal. The pair may decrease to 1.1830. The moving averages are passing in the positive territory above this level. A breakout and an upward retest of this level could give another sell signal and help the pair return to 1.1765. If so, it will considerably undermine the bullish trend. A more distant target will be the 1.1714 level where I recommend locking in profits. A retest of this level will adversely affect the bullish prospects of the pair. If GBP/USD advances and bears show no energy at 1.1902, the situation will stabilize with bulls regaining ground. They will again enter the market betting on a new wave of growth. Thus, GBP/USD could hit 1.1964. Only a false breakout of this level will give a sell signal. If bears fail to take control of this level, I would recommend you sell GBP/USD immediately at a bounce from 1.2021, keeping in mind a downward intraday correction of 30-35.
COT report
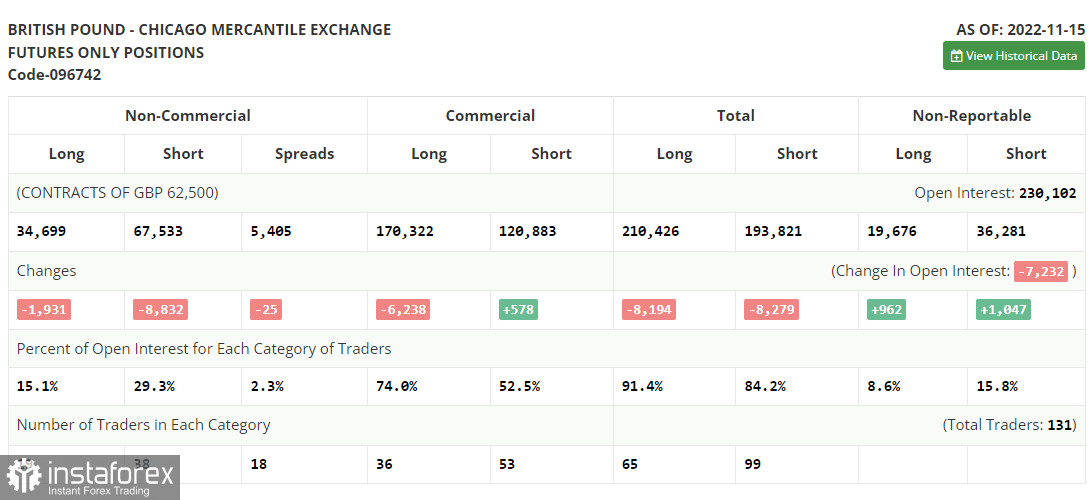
Commitments of Traders for November 15th logged a decline in both long and short positions. An unexpected surge in inflation in the UK is sure to impact the BoE's monetary policy stance. Given the persistently high inflation, the regulator has no choice but to stick to monetary tightening. If so, it will spur demand for the pound sterling. It will be able to climb higher versus the greenback. However, given the headwinds the UK economy is now facing, it will not be enough to attract investors to the market who firmly believe that the pound sterling has entered a long-term recovery cycle. Besides, the Fed remains strongly committed to aggressive tightening to cap galloping inflation. Hence, GBP/USD may be unable to start a rally in the medium term. According to the latest COT report, the number of long non-commercial positions dropped by 1,931 to 34,699 and the number of short non-commercial positions sank by 8,832 to 67,533, which led to a further increase in the negative non-commercial net position to -32,834 from -39,735 a week earlier. The weekly closing price of GBP/USD grew to 1.1885 against 1.1549.
Indicators' signals:
Trading is carried out above the 30 and 50 daily moving averages. It indicates that the pair is fluctuating in the sideways channel.
Moving averages
Note: The period and prices of moving averages are considered by the author on the H1 (1-hour) chart and differ from the general definition of the classic daily moving averages on the daily D1 chart.
Bollinger Bands
If GBP/USD moves up, the indicator's upper border at 1.1902 will serve as resistance.
Description of indicators
- Moving average (moving average, determines the current trend by smoothing out volatility and noise). Period 50. It is marked yellow on the chart.
- Moving average (moving average, determines the current trend by smoothing out volatility and noise). Period 30. It is marked green on the chart.
- MACD indicator (Moving Average Convergence/Divergence - convergence/divergence of moving averages) Quick EMA period 12. Slow EMA period to 26. SMA period 9
- Bollinger Bands (Bollinger Bands). Period 20
- Non-commercial speculative traders, such as individual traders, hedge funds, and large institutions who use the futures market for speculative purposes and meet certain requirements.
- Long non-commercial positions represent the total long open position of non-commercial traders.
- Short non-commercial positions represent the total short open position of non-commercial traders.
- Total non-commercial net position is the difference between the short and long positions of non-commercial traders.


