


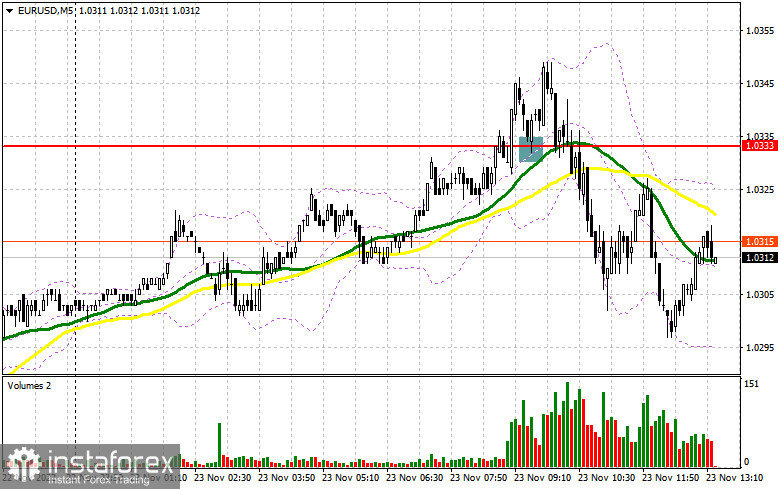
In the morning article, I turned your attention to 1.0333 and recommended making decisions on the market entry with this level in focus. Now, we should analyze the 5-minute chart and try to figure out what actually happened. A breakout and the opposite downward test of 1.0333 following the eurozone's PMIs generated a buy signal for EUR/USD. However, the price moved upwards about 11 pips from the market entry point. After the pair retreated to 1.0333 it became clear that the PMIs, albeit better than expected, indicate that the business activity is losing momentum. So, I decided to exit the market. So, I revised the technical picture for the second half of the day.
What is needed to open long positions on EUR/USD
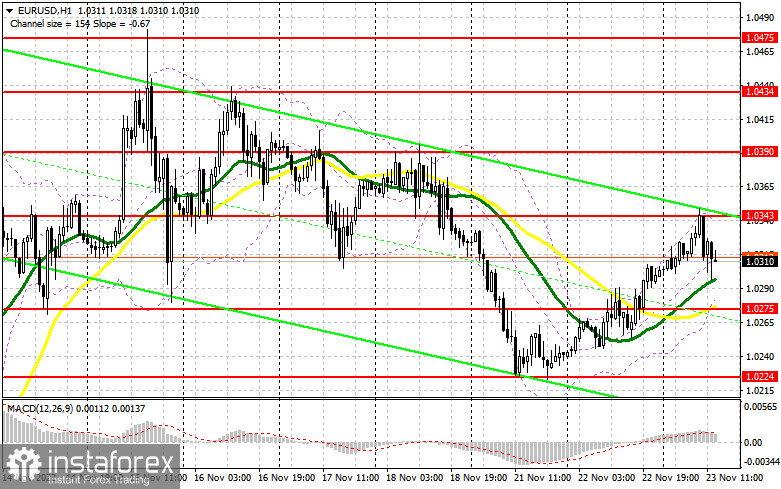
The market buzz is expected in the second half of the day. Investors are anticipating the same data on the US economy: the manufacturing PMI, services PMI, and composite PMI. Besides, traders will get to know US new home sales. An increase in sales will boost demand for the US dollar, thus exerting pressure on EUR/USD and entailing a downward correction. Nevertheless, investors will shift focus towards the minutes of the Fed's policy meeting in November. If the document contains hints that the Federal Reserve could soften its monetary tightening, the euro will grasp the chance of extending its uptrend. In case the currency pair declines in light of the US metrics, the reasonable decision would be opening long positions at a breakout of the morning support at 1.0275 which will provide the first buy signal for EUR/USD because the price could recover back to 1.0343, the level conquered in the first half of the day. A breakout and the higher highs amid the dovish Fed's minutes will reinforce the bullish force and open the door to 1.0390.
In case the price tops this level, traders might hope for a large upward move to 1.0434 where I recommend profit-taking. There could be a scenario of a decline in EUR/USD during the New York session. In case the buyers are inactive at 1.0275, the euro will come under selling pressure that will trigger another large drop. If so, only a false breakout at about the next support of 1.0224, the lowest level of the week, would be an excuse to buy the instrument. We should open long positions on EUR/USD immediately at a dip from 1.0180 or lower at 1.0132, bearing in mind a 30-35-pips correction intraday.
What is needed to open short positions on EUR/USD
The bears took advantage of the European statistics. Now, the US economic data and the Fed's minutes will matter a lot for further developments. If the data happen to be stronger than the consensus, we could project a larger downward correction. The best trading plan for short positions will be a false breakout around the new resistance at 1.0343. This will push the price to the market entry point and a further decline to the nearest support at 1.0275. Moving averages playing in favor of the buyers are passing slightly above this level. Once the instrument settles and updates this level upwards, the currency pair will generate an extra sell signal which will trigger buyers' stop losses. This price action will push EUR to 1.0224 where I recommend profit-taking. A more distant target is seen at 1.0180. Once it is hit, this will wreck the bullish trend. In case EUR/USD moves higher in the American session and the bears are inactive at 1.0343, which is a more realistic scenario, speculative sellers will exit the market. I would recommend selling the pair only at a false breakout. We could open short positions on EUR/USD immediately at a bounce at the high of 1.0434, bearing in mind a 30-35-pips downward correction.
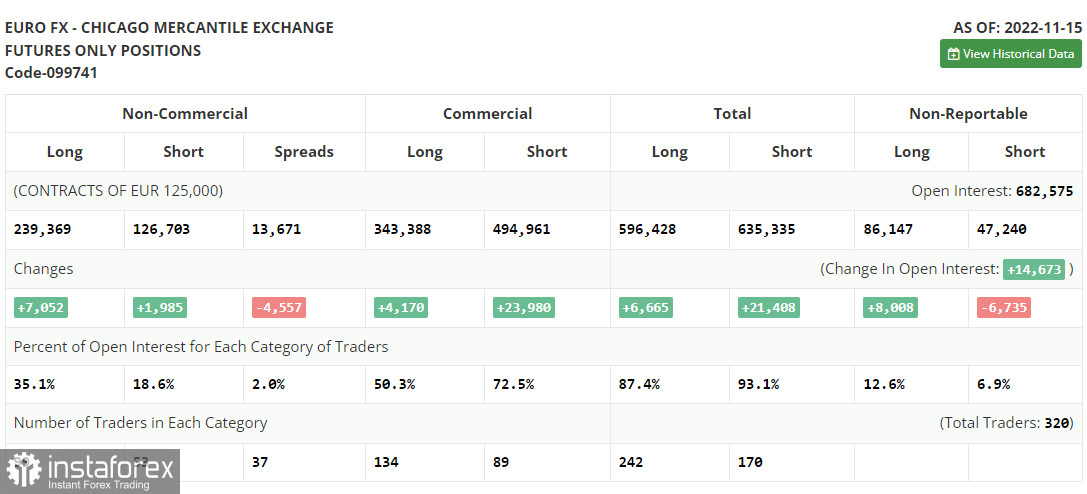
The COT report (Commitment of Traders) from November 15 logs an increase in both short and long positions. Recently, market participants are speculating on the Fed's softer stance on monetary tightening which could be announced in December. However, such assumptions stand in stark contrast to the latest US retail sales data for October. The actual reading was beyond the forecast which proves high inflationary pressure at the year-end. For this reason, we should take the recent US inflation report with a pinch of salt because the CPI indicated easing inflationary pressure.
Apparently, the Federal Reserve will stand pat on itshawkish agenda, going ahead with sharp rate hikes. As for the single European
currency, the demand for risky assets has grown a bit. Nevertheless, we could
hardly predict another explosive jump at the year-end following the latest EU
statistics, especially the EU GDP.
According to the COT report, long non-commercial positions
rose by 7,052 to 239,369 whereas short non-commercial positions grew by 1,985
to 126,703. The overall non-commercial net positions remained positive at
112,666 last week versus 107,599 a week ago. It means that investors are taking
advantage of the situation and carrying on buying the undervalued euro, even
though it is above the parity level. Traders are piling up long positions, reckoning
the resolution of the crisis. They are betting on EUR's strength in the long
term. EUR/USD closed at 1.0390 on Friday versus 1.0104 a week ago.
Indicators' signals:
Trading is carried out above the 30 and 50 daily moving averages. It indicates that the euro bulls are eager to enter the market.
Moving averages
Note: The period and prices of moving averages are considered by the author on the H1 (1-hour) chart and differ from the general definition of the classic daily moving averages on the daily D1 chart.
Bollinger Bands
If EUR/USD grows, the indicator's upper border at 1.0343 will serve as resistance.
Description of indicators
- Moving average (moving average, determines the current trend by smoothing out volatility and noise). Period 50. It is marked yellow on the chart.
- Moving average (moving average, determines the current trend by smoothing out volatility and noise). Period 30. It is marked green on the chart.
- MACD indicator (Moving Average Convergence/Divergence — convergence/divergence of moving averages) Quick EMA period 12. Slow EMA period to 26. SMA period 9
- Bollinger Bands (Bollinger Bands). Period 20
- Non-commercial speculative traders, such as individual traders, hedge funds, and large institutions that use the futures market for speculative purposes and meet certain requirements.
- Long non-commercial positions represent the total long open position of non-commercial traders.
- Short non-commercial positions represent the total short open position of non-commercial traders.
- Total non-commercial net position is the difference between short and long positions of non-commercial traders.


