


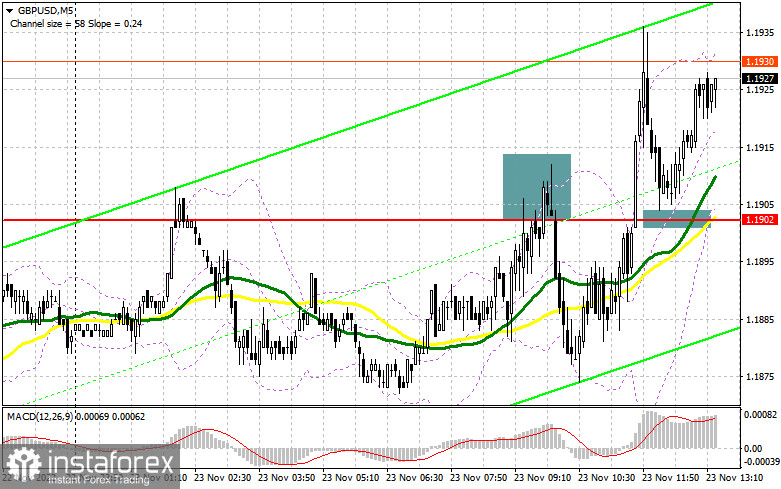
In my morning review, I mentioned the level of 1.1902 and recommended entering the market from there. Let's analyze the pair on the 5-minute chart. A rise and a failed attempt to settle above 1.1902 generated a sell signal and sent the pound down by more than 30 pips. However, the upbeat data on UK PMI limited the downside potential of the pair. A bit later, bulls broke above the level of 1.1902. A retest of this range has formed a buy signal which is still relevant at the moment of writing. If some of you have missed the moment to enter the market at 1.1902 as its test was not very accurate, this was also a good decision.
For long positions on GBP/USD:
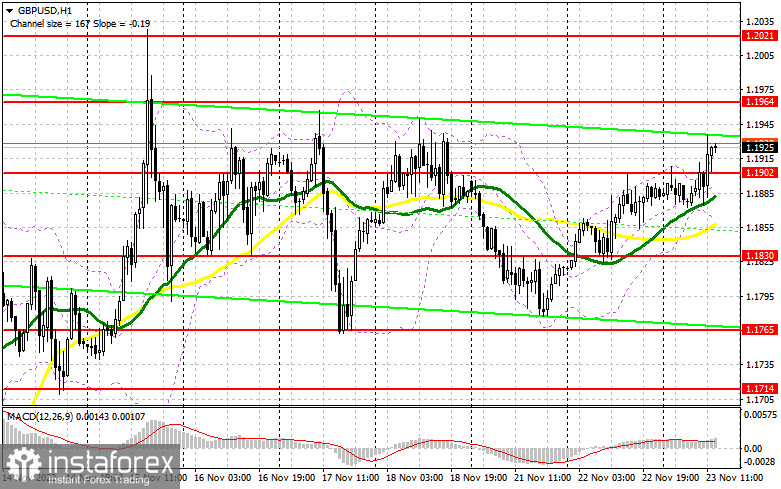
At the moment, bears are staying aside as they are waiting for the second half of the day. The US is due to publish the manufacturing and services PMIs, the composite PMI, and initial jobless claims. Another indicator to watch today is the data on new home sales. A rise in new home sales will increase the demand for the US dollar and will, therefore, put pressure on the pair. If so, GBP/USD will start a downward correction. However, the decisive factor will be the Fed's meeting minutes for November. Any hint that the regulator is going to ease its policy in the future will push the pound up to monthly highs. So, traders need to be careful with selling the pair. Given that the technical setup remained the same, the best point to go long on the pair will be at the support level of 1.1902. Just below this level, the moving averages supporting the bulls are located. Only a false breakout will create a good entry point for long positions, with a possible advance to the weekly high of 1.1964. A breakout of this range and its downward retest will form a buy signal with the target at 1.2021, given that the FOMC minutes are dovish. The high of 1.2078 will act as the furthest target where I recommend profit taking. If bulls fail to protect the level of 1.1902 in the afternoon, massive profit-taking may start. In this case, I would recommend buying the pair only near the support of 1.1830. It is possible to open long positions on GBP/USD right after a rebound from 1.1765 or 1.1714, keeping in mind a possible intraday correction of 30-35 pips within the day.
For short positions on GBP/USD:
The buyers are steadily approaching the area of 1.1964 where the pound bears have to take action unless they want to retreat. So, the main task for the sellers for now is to maintain control of 1.1964. It would be great to see a false breakout at this level after the reports are published. This will generate a sell signal with a prospect of a further advance to 1.1902. This level served as resistance in the morning trade. Its breakout and an upward retest will confuse the bulls. If so, the pair will come under pressure and a new sell signal will appear with the target at 1.1830. At this point, bears may face some difficulties. The area of 1.1765 will act as the most distant target where I recommend profit taking. If the pair fails to develop a strong fall from 1.1964 and the morning scenario is repeated, bulls will continue to buy the pound, thus pushing it upwards to the monthly high of 1.2021. Only a false breakout of this level will create an entry point for short positions considering a further decline. If nothing happens there as well, I would recommend selling GBP/USD right after a rebound from 1.2078, bearing in mind a possible correction of 30-35 pips within the day.
COT report:
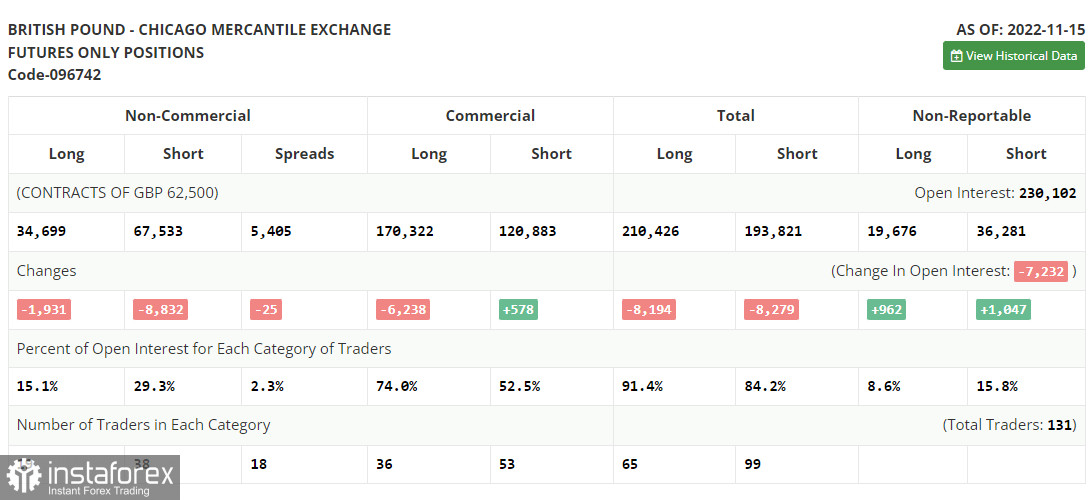
The Commitments of Traders report for November 15 showed a decline in both short and long positions. A rapid surge in the UK inflation rate came as a big surprise to the market and has most likely influenced the plan of the Bank of England regarding interest rate hikes. Considering the current situation, the regulator will be forced to continue its ultra-tight monetary policy. This will support the demand for the British pound and allow it to strengthen against the US dollar. At the same time, the existing problems in the UK economy confirmed by the recent GDP report are unlikely to attract large market players to the pound. Few of them believe in a long-term uptrend in the British currency. We should keep in mind that the US Federal Reserve is also raising interest rates to curb inflation which is another bearish factor for GBP/USD in the medium term. According to the recent COT report, long positions of the non-commercial group of traders dropped by 1,931 to 34 699 while short positions fell by 8,832 to 67,533. This resulted in the non-commercial net position declining further to -32,834 from -39,735 a week ago. The weekly closing price went up to 1.1885 from 1.1549.
Indicator signals:
Moving Averages
Trading above the 30- and 50-day moving averages indicates that buyers are returning to the market.
Please note that the time period and levels of the moving averages are analyzed only for the H1 chart, which differs from the general definition of the classic daily moving averages on the D1 chart.
Bollinger Bands
If the pair declines, the lower band of the indicator at 1.1880 will act as support.
Description of indicators:
• A moving average of a 50-day period determines the current trend by smoothing volatility and noise; marked in yellow on the chart;
• A moving average of a 30-day period determines the current trend by smoothing volatility and noise; marked in green on the chart;
• MACD Indicator (Moving Average Convergence/Divergence) Fast EMA with a 12-day period; Slow EMA with a 26-day period. SMA with a 9-day period;
• Bollinger Bands: 20-day period;
• Non-commercial traders are speculators such as individual traders, hedge funds, and large institutions who use the futures market for speculative purposes and meet certain requirements;
• Long non-commercial positions represent the total number of long positions opened by non-commercial traders;
• Short non-commercial positions represent the total number of short positions opened by non-commercial traders;
• The non-commercial net position is the difference between short and long positions of non-commercial traders.


