


Economic calendar for November 23
Yesterday, traders received preliminary data on business activity in Europe, Britain, and the United States
Statistics details:
A flash reading of S&P Global's Eurozone manufacturing purchasing managers' index increased to 47.3 in November from 46.4 in October, above market forecasts for a reading of 46.
The Eurozone services PMI stood at 48.6 in November 2022, unchanged from October's reading and above market expectations of 48.
The Eurozone composite purchasing managers' index rose to 47.8 in November from 47.3 in the previous month.
The euro reacted positively to statistics.
The UK's flash manufacturing PMI remained unchanged at 46.2 in November, surpassing the preliminary estimate of 45.7
The UK's services PMI held at 48.8 in November, while economists predicted a decline to 48.0.
Britain's composite purchasing managers' index edged up to 48.3 from 48.2.
Likewise, the pound sterling reacted to statistics with gains.
The S&P Global US Manufacturing PMI fell to 47.6 in November from 50.4 in October, well below a forecast of 50.
The S&P Global US Services PMI dropped to 46.1 in November, down from 47.8 in October and missing market expectations of 47.9.
The US dollar was also weighed down by downbeat data on the US labor market.
Statistics details:
The number of Americans filing continuing claims for unemployment benefits increased to 1.551 million from 1.503 million.
US initial jobless claims rose to 240,000 last week from 223,000 the previous week.
Against this background, the US dollar slid against its competitors.
Overview of trading charts for November 23
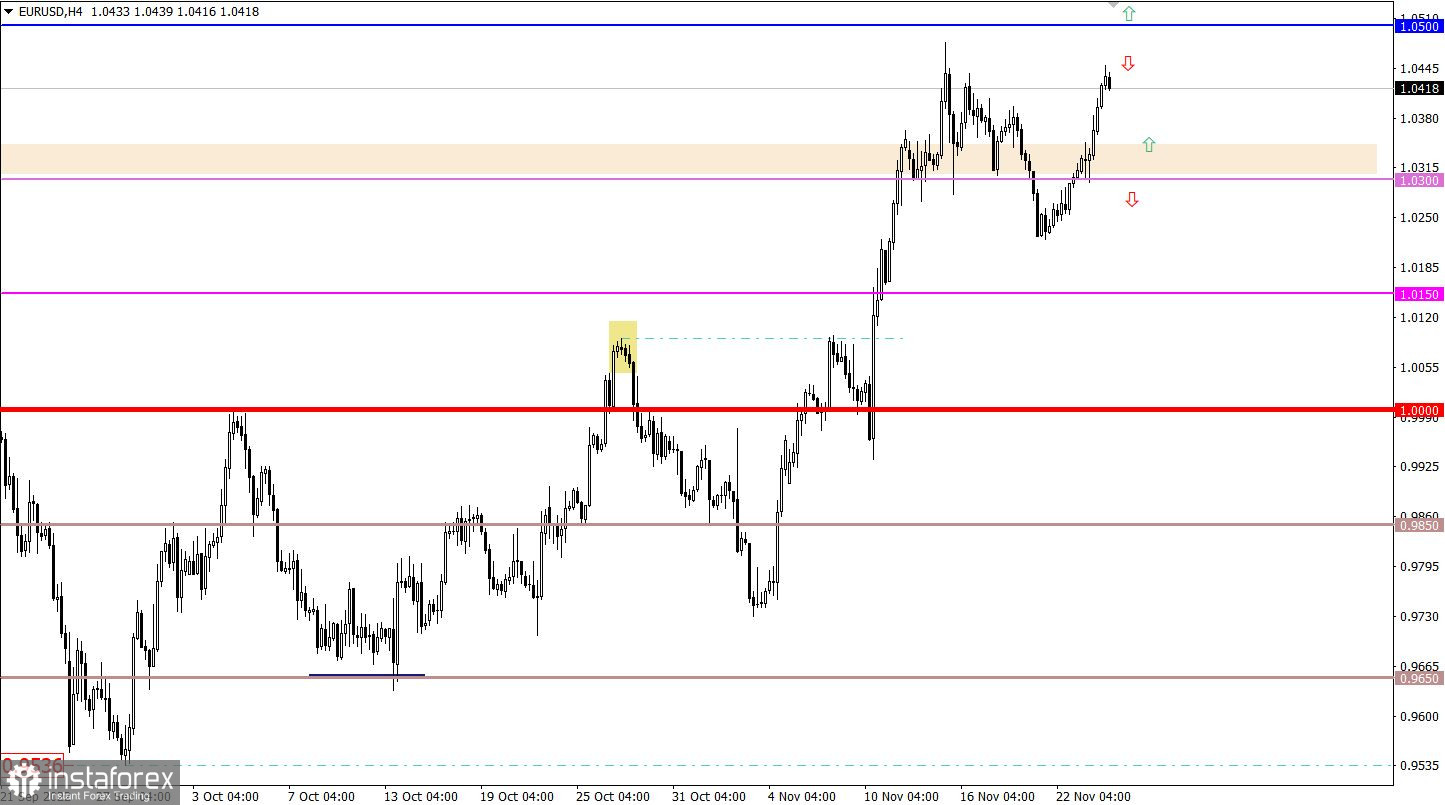
After breaking above the level of 1.0300, the EUR/USD pair managed to gain value. As a result, the pair recovered from its recent correction from the resistance level of 1.0500.
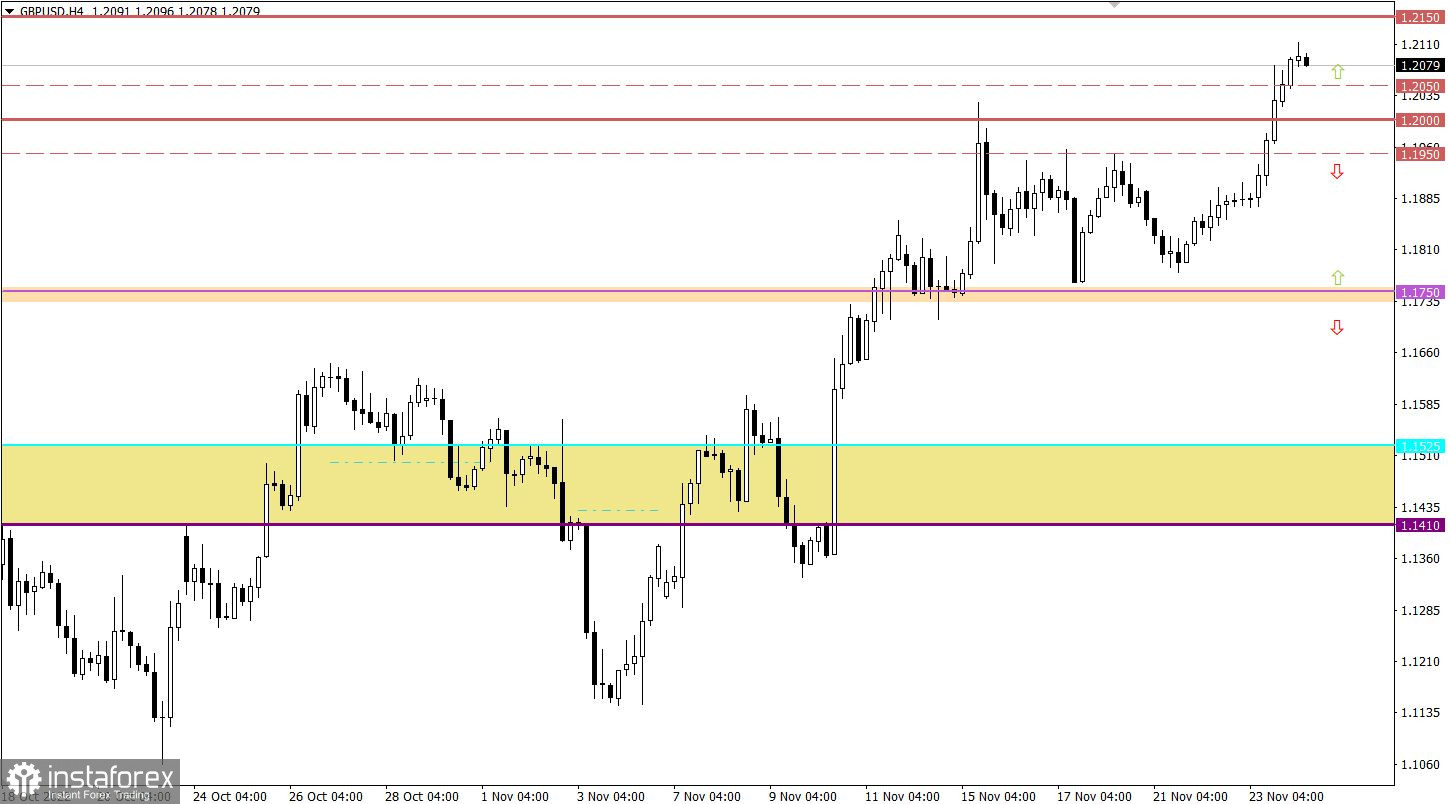
Meanwhile, the GBP/USD pair got out the sideways range of 1.1750/1.1950 by breaking its upper boundary. The volume of long positions increased sharply, and the British pound gained strong upside momentum. As a result, the quote rose above the psychological level of 1.2000.

Economic calendar for November 24
Today, the US market is closed for Thanksgiving Day. That is why banks, funds, and companies do not operate in the country. This means that trading volumes will be reduced.
Besides, today's macroeconomic calendar is bereft of any important releases from Europe and the UK. The only thing you should pay attention to is the accounts of the ECB monetary policy meeting. However, all the key points are already known. Traders may also take notice of speeches by ECB members. Perhaps their comments will be of interest to speculators.
Time targeting
ECB Monetary Policy Meeting Accounts - 3:30 PM UTC +3
ECB Guindos Speech - 2:15 PM UTC +3
ECB Schnabel Speech - 4:00 PM UTC +3
ECB Enria Speech - 4:15 PM UTC +3
EUR/USD trading plan for November 24
Given that the pair has gained strong upside momentum over the past 24 hours, it can be assumed that long positions on the euro are overheated in the intraday timeframe. This suggests that the price will soon slow down the pace of its upward cycle or enter a short-term pullback. The level of 1.0500 still acts as resistance on the way of buyers.
Notably, an overbought signal may be ignored by speculators in the event of an inertial move. If the price consolidates above 1.0500 on the daily chart, the euro may well extend gains.
GBP/USD trading plan for November 24
There is a technical signal that the pound sterling is overbought in the short-term. This means that the British pound is likely to slow down the pace of its upward cycle, which may result in a pullback. However, if the price consolidates above 1.2050, buyers will have every chance of pushing the price further up.
What is shown on trading charts?
The candlestick chart shows white and black graphical rectangles with lines above and below. While conducting a detailed analysis of each individual candlestick, you can notice its features intrinsic to a particular timeframe: the opening price, the closing price, as well as the highest and lowest prices;
Horizontal levels are price levels reflecting a stop or a reversal. These levels are called support and resistance;
Circles and rectangles are highlighted examples where the price reversed in the course of its history. This color highlighting indicates horizontal lines that may exert pressure on the quote in the future;
Up/down arrows signal a possible future price direction.
Traders are recommended to read the following article:
EUR/USD and GBP/USD: trading plan for beginners on November 23, 2022


