


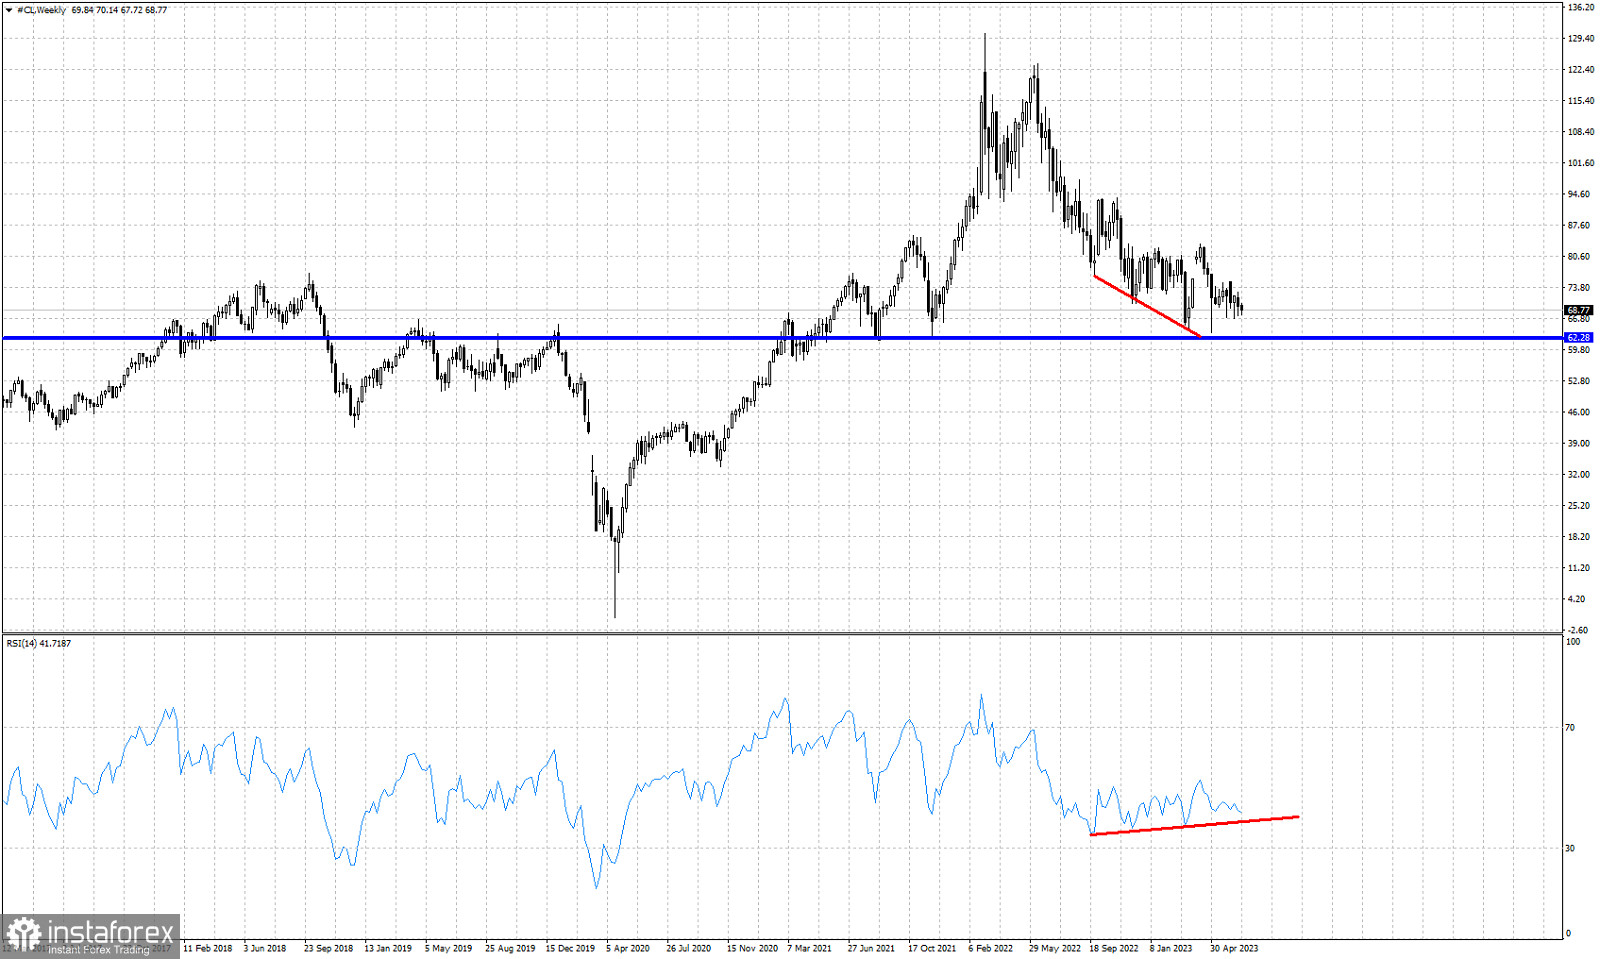
Red lines- bullish RSI divergence
Blue line- horizontal support/neckline
Oil prices are continuing their drift lower as price continues making lower lows and lower highs. Price is trading around $68.40 very close to the long-term horizontal support of $62-$62.50. Price action in the weekly chart for the last 10 months has been very choppy. The new lower lows by price have not been followed by the RSI providing bullish divergence signals. The RSI bullish divergence is not a reversal signal but only a warning. What the above chart suggests is that price is approaching a major support that has been tested several times over the past few years and that the down trend is weakening. Therefore the chances of a reversal are increasing. Recent highs at $75 are the first step bulls need to make in order to reclaim the trend. Next major resistance is at $83.50. Breaking above these two price levels will confirm a trend reversal. Around current levels we prefer to start opening new long positions gradually with stops at the $62 price level. We believe that Oil price has upside potential at least towards $83 and we will add to our positions as price slowly changes trend in the lower time frames.


