


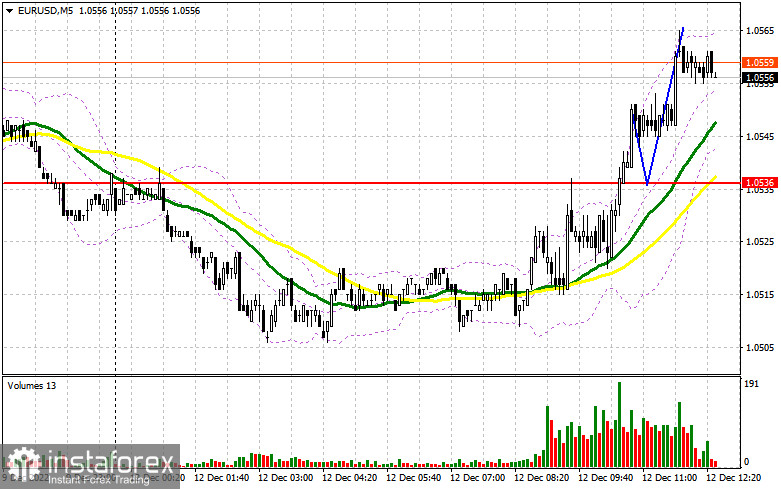
In the morning article, I turned your attention to 1.0536 and recommended making decisions with this level in focus. Now, let's look at the 5-minute chart and figure out what actually happened. A breakout of 1.0536 occurred without a downward retest. Hence, I did not find a good entry point into long positions. There were no other signals as well. In the afternoon, the technical outlook was partially revised but the trading strategy remained unchanged.
When to open long positions on EUR/USD:
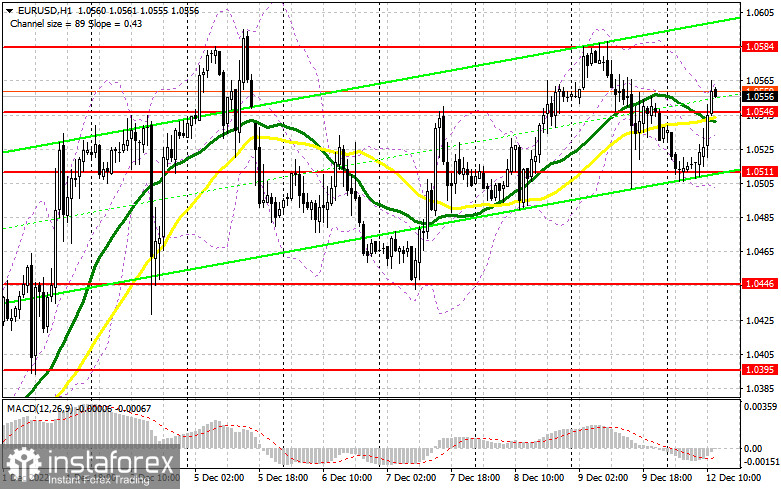
Trading volumes and market volatility are likely to be moderate in the American session as only the US Budget Execution report is on tap. This report will hardly impact Forex. This is why traders may increase long positions on the euro. For a further rise, bulls need to protect the support level of 1.0546 where the moving averages are passing in the positive territory. A drop and a false breakout of this level will give a buy signal with the prospect of a jump to 1.0584, the upper border of the sideways channel. This level is located near the monthly high. A breakout and a downward retest of this level will cement the bullish momentum, opening the way to 1.0624. The pair is unlikely to rise above this level, especially before the release of US inflation data scheduled for tomorrow. A more distant target will be the 1.0663 level where I recommend locking in profits. If EUR/USD declines during the US session and bulls show no activity at 1.0546, the pressure on the euro will increase. Those bulls who have been betting on the prolongation of the uptrend will have to close Stop Loss orders. In this case, only a false breakout of the support level of 1.0511, the lower border of the sideways channel, will create new entry points in long positions. You could buy EUR/USD immediately at a bounce from 1.0446 or even lower at 1.0395, keeping in mind an upward intraday correction of 30-35 pips.
When to open short positions on EUR/USD:
Sellers are now unwilling to enter the market, waiting for the release of the inflation report. They need to regain control of the 1.0546 level, which acted as resistance in the morning but also to defend 1.0584, the upper border of the sideways channel. A false breakout of this level may take place just at the time of the release of US crucial macro stats. This could provide new selling opportunities. The euro is likely to slide to the middle of the sideways channel and the support level of 1.0546 where the moving averages are benefiting bulls. A breakout below this level as well as an upward retest will give an additional sell signal, forcing bulls to close Stop Loss orders. The euro may take a nosedive to 1.0511 where I recommend locking in profits. A more distant target will be the 1.0446 level. If EUR/USD rises during the US session and bears show no energy at 1.0584, sellers are likely to lose momentum. so, bulls will have a chance to push the pair to the monthly high of 1.0624. I would advise you to open short positions at this level only if a false breakout takes place. You could sell EUR/USD immediately at a bounce from 1.0663, keeping in mind a downward intraday correction of 30-35 pips.
COT report
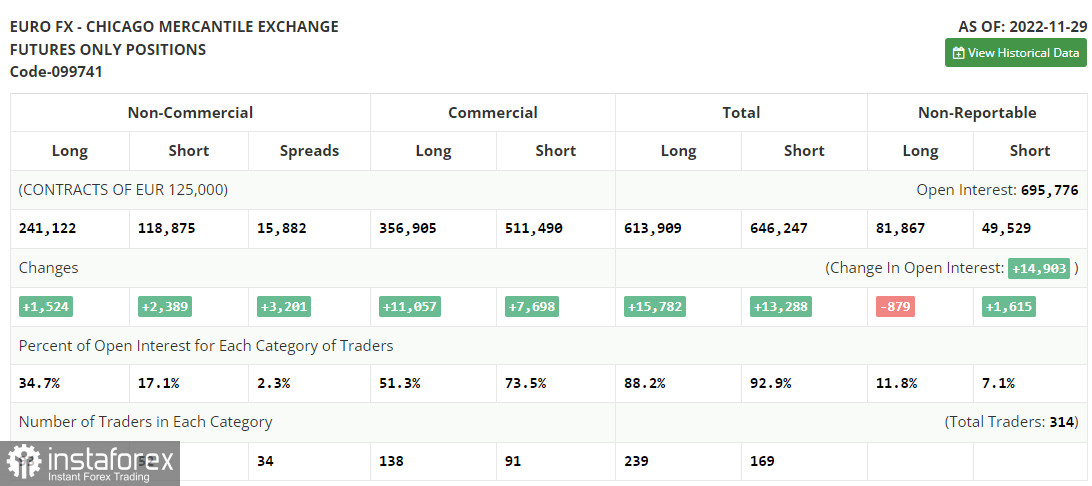
According to the COT report from November 29, the number of both long and short positions increased. Announcements made by Jerome Powell last week retained demand for risk assets, including the euro. Since the pair has been confidently rising since November, there are a lot of traders who prefer selling at the current levels. Recent fundamental data from the US, namely, business activity and labor market indicators, allowed traders to bet on a longer period of higher interest rates in the US in the upcoming year. Against the backdrop, there is no good reason to open long positions in the midterm. The higher the euro climbs, the deeper it will fall. The week is expected to be calm and traders are likely to shift their attention to the FOMC meeting, which is scheduled for December 13-14. According to the COT report, the number of long non-commercial positions increased by 1,524 to 241,122, whereas the number of short non-commercial positions jumped by 2,389 to 118,875. At the end of the week, the total non-commercial net position decreased slightly to 122,234 from 123,112. This indicates that investors are no longer in such a hurry to buy back the euro since it is not as cheap as it was a few months earlier. The weekly closing price advanced to 1.0342 from 1.0315.
Indicators' signals:
The EUR/USD pair is trading near the 30 and 50 daily moving averages. It indicates that traders are hesitant to pick up a trend.
Moving averages
Note: The period and prices of moving averages are considered by the author on the H1 hourly chart and differ from the general definition of the classic daily moving averages on the daily D1 chart.
Bollinger Bands
If EUR/USD falls, the indicator's lower border at 1. 0511 will serve as support.
Description of indicators
- Moving average (moving average, determines the current trend by smoothing out volatility and noise). Period 50. It is marked yellow on the chart.
- Moving average (moving average, determines the current trend by smoothing out volatility and noise). Period 30. It is marked green on the chart.
- MACD indicator (Moving Average Convergence/Divergence - convergence/divergence of moving averages) Quick EMA period 12. Slow EMA period to 26. SMA period 9
- Bollinger Bands (Bollinger Bands). Period 20
- Non-commercial speculative traders, such as individual traders, hedge funds, and large institutions that use the futures market for speculative purposes and meet certain requirements.
- Long non-commercial positions represent the total long open position of non-commercial traders.
- Short non-commercial positions represent the total short open position of non-commercial traders.
- Total non-commercial net position is the difference between the short and long positions of non-commercial traders.


