


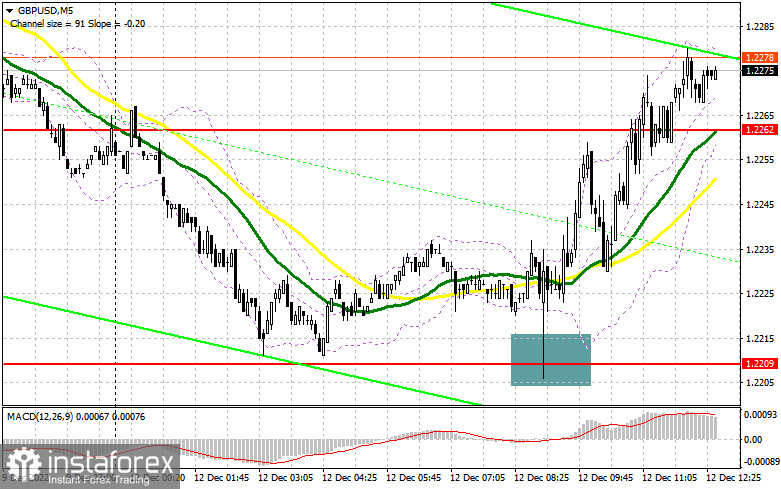
In the morning article, I highlighted the level of 1.2209 and recommended making decisions on market entry with this level on focus. Let's analyze the 5-minute chart and try to figure out what happened in the first half of the day. A decline and a false breakout there created excellent conditions for increasing long positions, reckoning a further uptrend. By the moment of writing this article, GBP/USD had climbed more than 75 pips.
What is needed to open long positions on GBP/USD
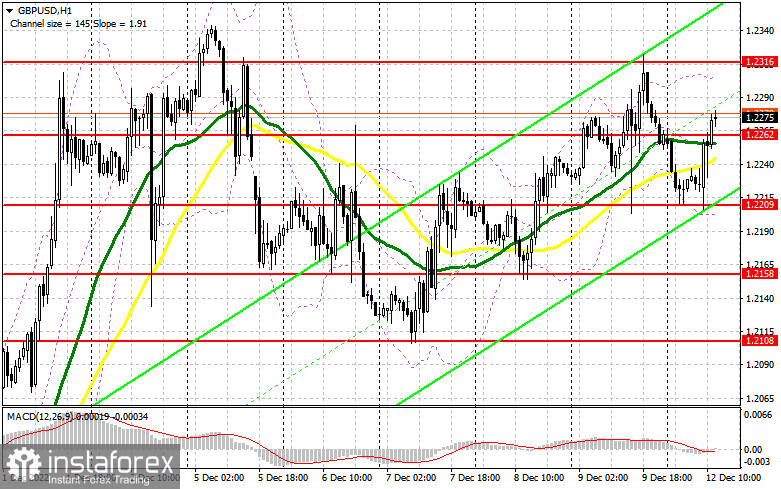
In the second half of the day, nothing may hurt the sterling. So, we can predict higher highs from Friday's levels. As long as GBP/USD is trading above 1.2262, demand for the British pound remains robust. The Federal Budget Balance by the Federal Reserve will hardly influence GBP/USD's trajectory. Certainly, traders are interested in another market entry point to buy the sterling, following the overall bullish trend with the aim of updating 1.2316. A breakout and a test of this level downwards will encourage the buyers as the price will provide a buy signal with the target at December's high of 1.2367. The higher target is seen at 1.2367 where I recommend profit-taking. If the bulls don't cope with this task in the second half of the day and miss 1.2262, which is the most realistic scenario before the US CPI tomorrow, GBP/USD will come under pressure again.
Hence, we could see a large downward move with the prospects of updating the lower border of the sideways range at 1.2209. I would recommend opening long positions on GBP/USD immediately at a drop from 1.2158 or lower from 1.2108, bearing in mind a 30-35-pips intraday correction.
What is needed to open short positions on GBP/USD
Meanwhile, the sellers are in no hurry to enter the market, especially after they missed resistance at 1.2262 which used to give them hope for a downward move. Now the time is ripe to think how to regain control over 1.2262 and to defend 1.2316. Only a false breakout at this level will open an excellent point for short positions, reckoning a decline to the middle of the trading range at 1.2262. A breakout and the opposite test upwards will create an extra sell signal and bring down to land the buyers. The bears will foresee a downward move to 1.2209, the support formed in the morning, where the buyers asserted themselves. The bears will encounter difficulties again. The lower target is defined at 1.2158 where I recommend profit-taking. If we don't see an active downward move from 1.2316, the bulls will try to break above one-month highs. As a result, the price could spike to 1.2367. A false breakout there will generate a nice entry point for short positions, relying on a downward move. In case the bulls are not active there, I would recommend selling GBP/USD immediately at a bounce from 1.2410, bearing in mind a 30-35-pips intraday downward move.
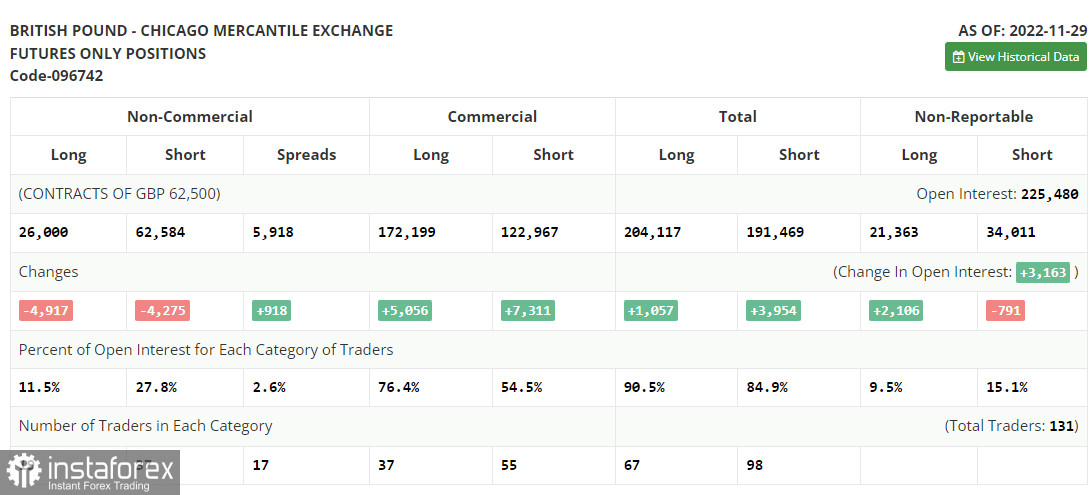
In the COT report (Commitment of Traders) for November 29, both short positions and long positions continued to decline. Obviously, the recent statistics are not optimistic. Dismal macroeconomic data warns of a looming recession. Remarkably, the Bank of England does not intend to take efficient measures to prevent a recession because the top priority is to adopt countermeasures against soaring inflation, which has been sharply accelerating as the latest data showed. Against this background, it is not surprising why traders prefer to stay on the sidelines. They are hesitating either to buy or sell the pound sterling.
If you look at how much the pair has risen since November this year, there is no desire to go long at the current highs at all, as the US economy continues to show excellent performance, which will certainly revive demand for the dollar after the Federal Reserve meeting this week.
The latest COT report indicated that long non-commercial positions decreased by 4,197 to 26,000, while short non-commercial positions decreased by 4,275 to 62,584, which led to an increase in the negative value of the non-commercial net position to -36,584 against -35,942 a week earlier. GBP/USD closed last week higher at 1.1958 against 1.1892 a week ago.
Indicators' signals:
The currency pair is trading at around the 30 and 50 daily moving averages. It indicates market uncertainty.
Moving averages
Note: The period and prices of moving averages are considered by the author on the H1 hourly chart and differ from the general definition of the classic daily moving averages on the daily D1 chart.
Bollinger Bands
If GBP/USD goes down, the indicator's lower border at 1.2209 will serve as support.
Description of indicators
- Moving average (moving average, determines the current trend by smoothing out volatility and noise). Period 50. It is marked yellow on the chart.
- Moving average (moving average, determines the current trend by smoothing out volatility and noise). Period 30. It is marked green on the chart.
- MACD indicator (Moving Average Convergence/Divergence — convergence/divergence of moving averages) Quick EMA period 12. Slow EMA period to 26. SMA period 9
- Bollinger Bands (Bollinger Bands). Period 20
- Non-commercial speculative traders, such as individual traders, hedge funds, and large institutions that use the futures market for speculative purposes and meet certain requirements.
- Long non-commercial positions represent the total long open position of non-commercial traders.
- Short non-commercial positions represent the total short open position of non-commercial traders.
- Total non-commercial net position is the difference between short and long positions of non-commercial traders.


