


Analyzing Monday's trades:
EUR/USD on 30M chart
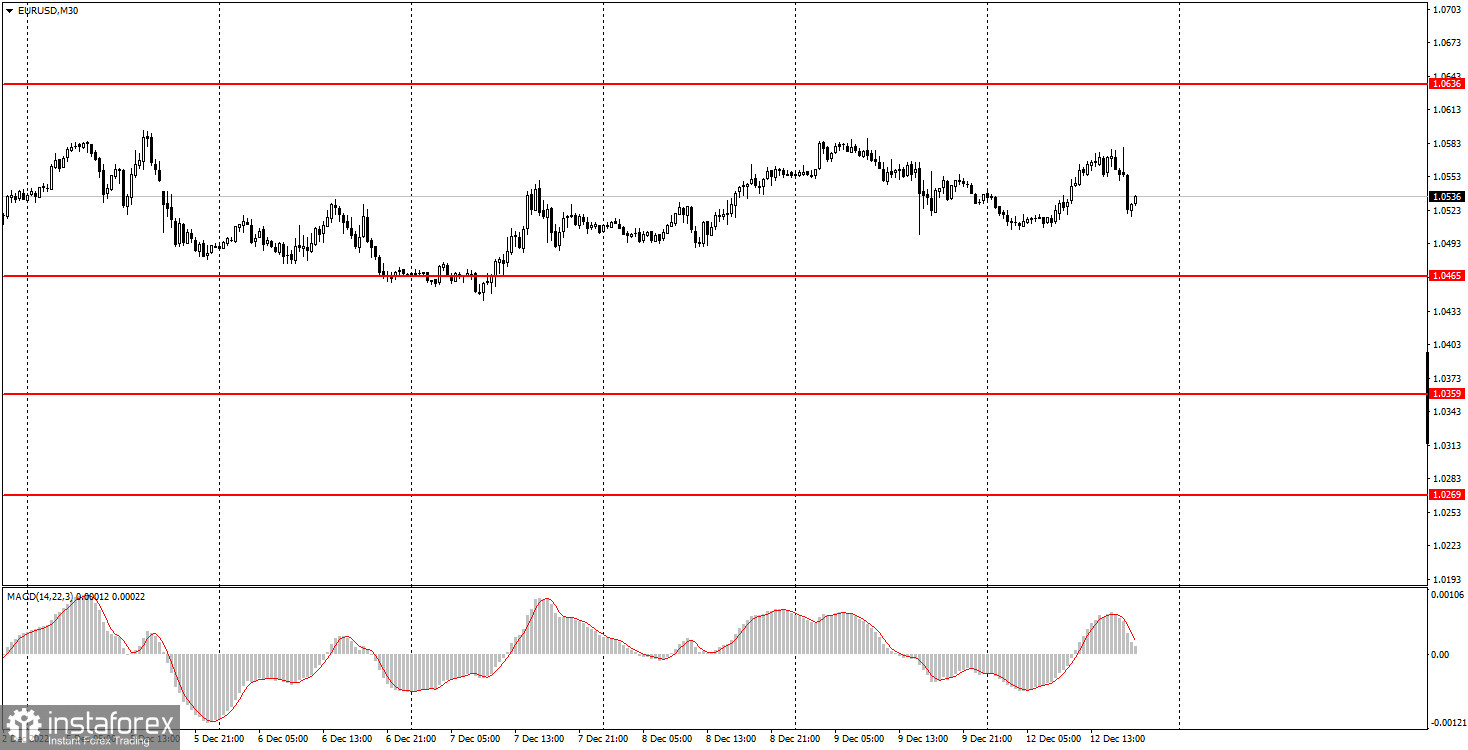
EUR/USD traded mainly sideways on Monday. In fact, even the 30-minute chart above perfectly shows that we've been seeing such a movement for more than a week. Despite a huge number of important events and reports scheduled for this week, there was nothing that was interesting on Monday in either the United States or the European Union. That's why traders simply had nothing to react to during the day. Hence, this is the nature of the movement. We thought that the market may start to work out the central bank meetings in advance (as it often likes to do), but so far we have not seen anything like that. We would add a horizontal channel to the chart, but there is no need for it, because the nature of the movement is clearly visible. Thus, beginners should just wait for all the planned events and trade very cautiously this week, because it is impossible to predict the reaction right now.
EUR/USD on M5 chart
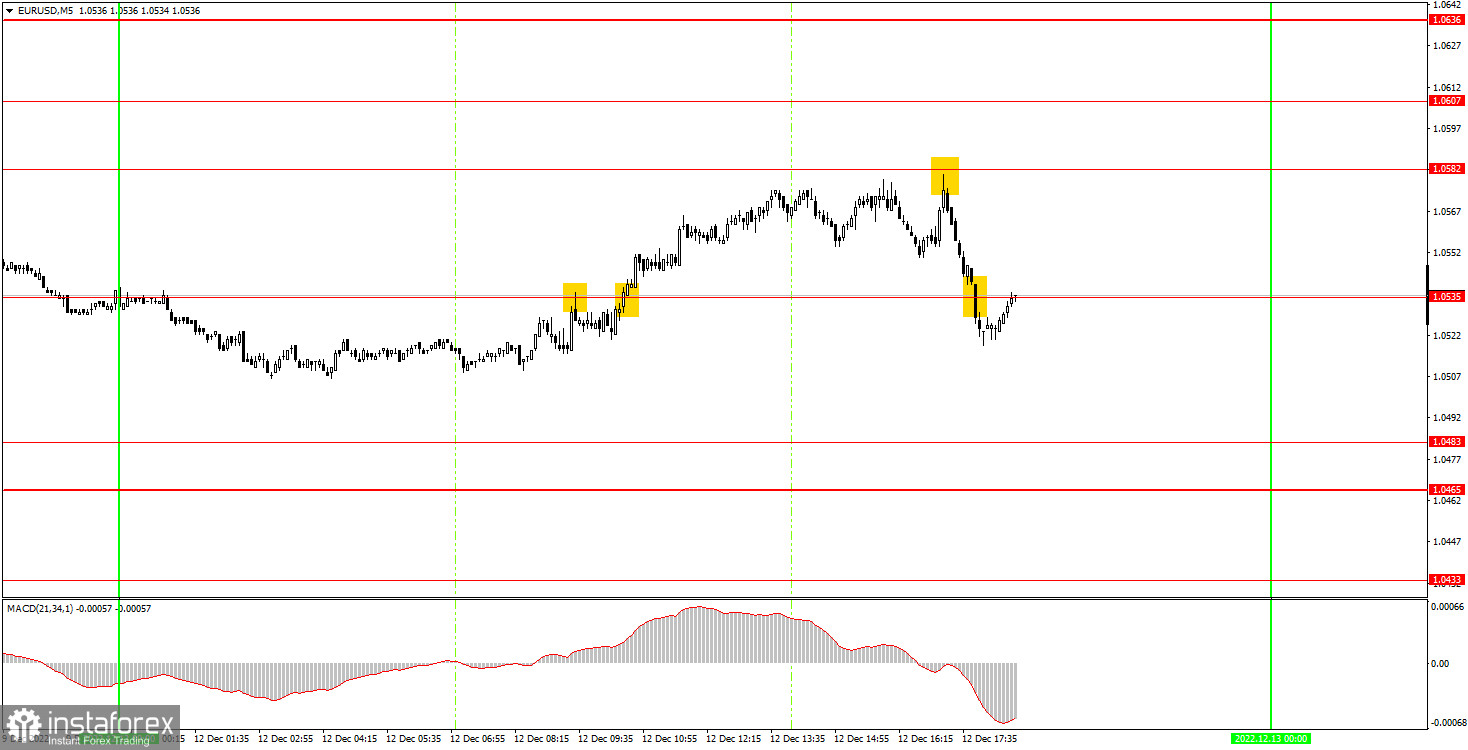
Monday's trading signals were not very good, but not too bad either. Since there has been a sideways movement on the higher chart for more than a week, it was difficult to count on serious movements on the 5-minute chart. The first sell signal turned out to be false. The price rebounded from 1.0535 and failed to go even 15 points in the right direction, so the deal closed with a loss of about 20 points. Later the buy signal followed near the same level of 1.0535, after which the pair easily rose to 1.0582, from which it rebounded with a margin of about 2 pips. At this point, the longs (20 pips profit) should have been closed while short positions were opened. In just half an hour, the pair was near 1.0535, but it failed to continue the fall and almost immediately stopped above this level. Based on this signal it was necessary to close the shorts. The profit amounted to 20 pips. In general, the day turned out to be profitable.
Trading tips on Tuesday:
The uptrend has been canceled on the 30-minute chart, and the price has actually been moving sideways for over a week. We haven't seen a trend lately. This week, the movements could be quite volatile and also there are many sharp reversals. On the 5-minute chart on Tuesday, it is recommended to trade at the levels of 1.0354, 1.0391, 1.0433, 1.0465-1.0483, 1.0535, 1.0582-1.0607, 1.0636, 1.0663, 1.0697. As soon as the price passes 15 pips in the right direction, you should set a Stop Loss to breakeven. There are no important reports or events scheduled for Tuesday in the EU, but the US will release an inflation report, which is now almost as important to the market as the Federal Reserve meeting.
Basic rules of the trading system:
1) The strength of the signal is determined by the time it took the signal to form (a rebound or a breakout of the level). The quicker it is formed, the stronger the signal is.
2) If two or more positions were opened near a certain level based on a false signal (which did not trigger a Take Profit or test the nearest target level), then all subsequent signals at this level should be ignored.
3) When trading flat, a pair can form multiple false signals or not form them at all. In any case, it is better to stop trading at the first sign of a flat movement.
4) Trades should be opened in the period between the start of the European session and the middle of the US trading hours when all positions must be closed manually.
5) You can trade using signals from the MACD indicator on the 30-minute time frame only amid strong volatility and a clear trend that should be confirmed by a trendline or a trend channel.
6) If two levels are located too close to each other (from 5 to 15 pips), they should be considered support and resistance levels.
On the chart:
Support and Resistance levels are the levels that serve as targets when buying or selling the pair. You can place Take Profit near these levels.
Red lines are channels or trend lines that display the current trend and show in which direction it is better to trade now.
The MACD indicator (14, 22, and 3) consists of a histogram and a signal line. When they cross, this is a signal to enter the market. It is recommended to use this indicator in combination with trend patterns (channels and trendlines).
Important announcements and economic reports that can be found on the economic calendar can seriously influence the trajectory of a currency pair. Therefore, at the time of their release, we recommend trading as carefully as possible or exiting the market in order to avoid sharp price fluctuations.
Beginners on Forex should remember that not every single trade has to be profitable. The development of a clear strategy and money management is the key to success in trading over a long period of time.


