


Analyzing Monday's trades:
GBP/USD on 30M chart
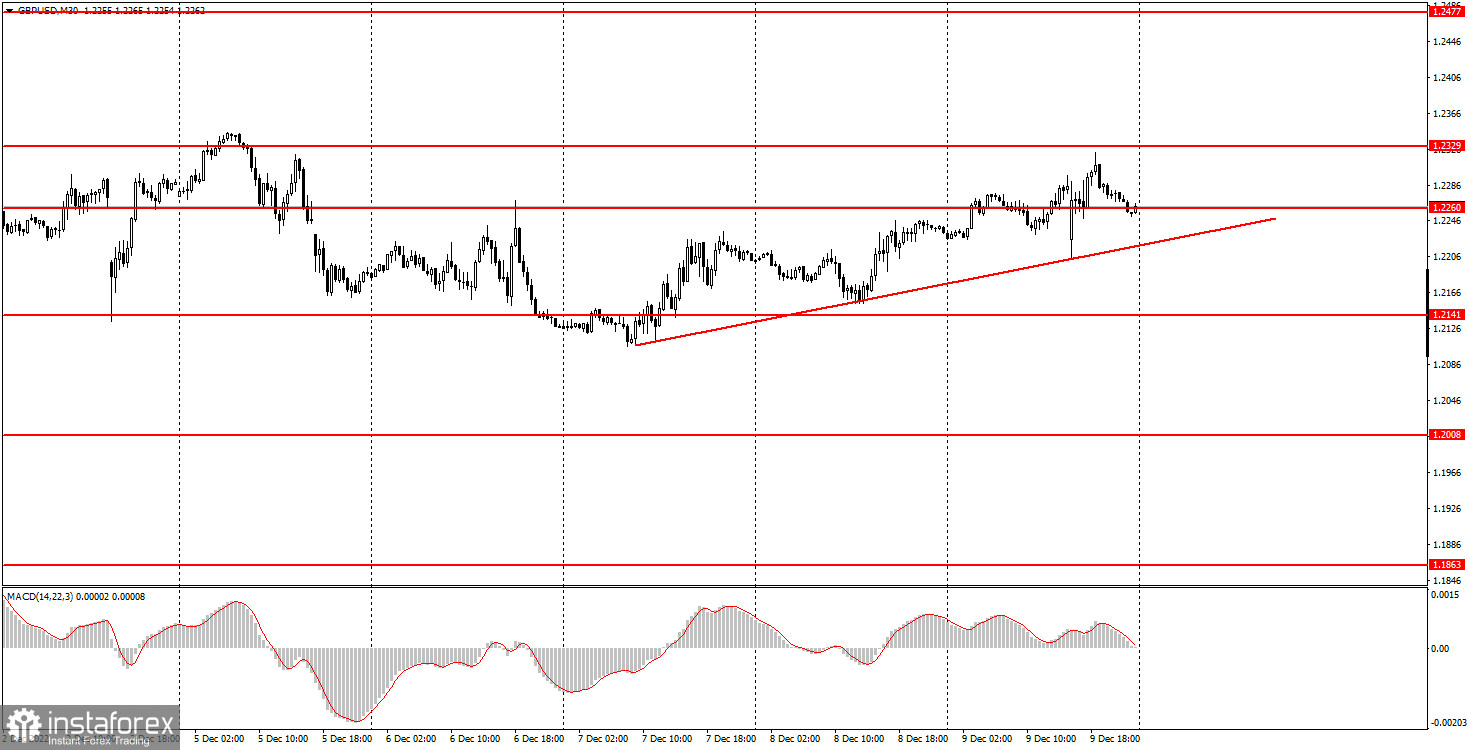
GBP/USD also traded rather indistinctly and inconspicuously on Monday. The pair was able to resist falling below the ascending trend line, which we formed yesterday. But at the same time, there is no trace of the uptrend.Thus, the trend line seems conditional, and taking this week's fundamental and macroeconomic background into consideration, it is quite difficult to expect what will happen next. The pair could show sharp movements on Tuesday because the most important report on US inflation will be published on this day. Also, the GDP and industrial production reports were just released in the UK. These aren't exactly the "latest" reports, but the volatility of the day was about 90 pips, which is not much for the pound. Therefore, even if there was a reaction, it still turned out to be very weak. So now the pound still has a lot of chances to rise, but at the same time these chances are no more than 51/49. Everything will depend on this week's fundamental and macroeconomic background.
GBP/USD on M5 chart
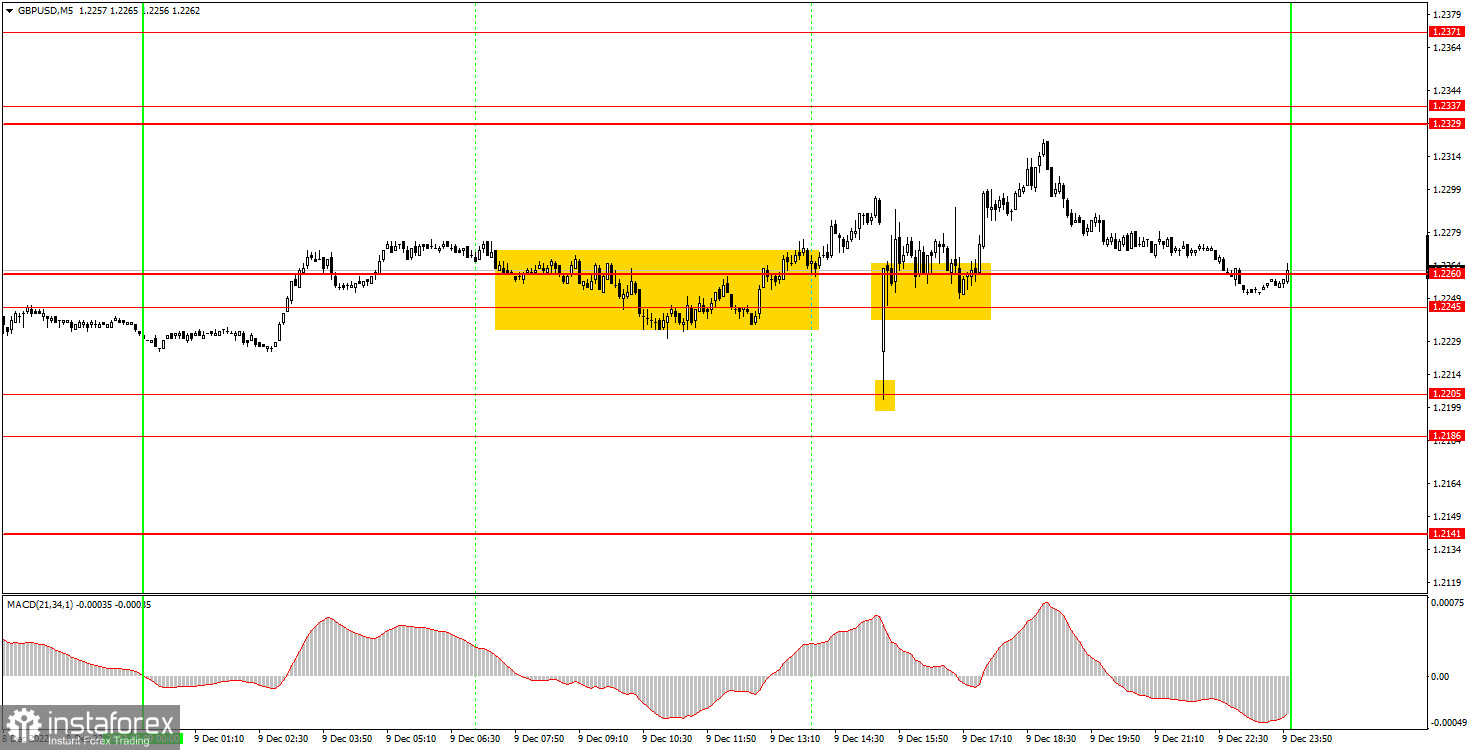
Speaking of trading signals on the 5-minute chart, it was quite complicated. At first the pair rebounded from 1.2205 and managed to rise to the area of 1.2245-1.2260, from which it also rebounded. Thus, it was possible to earn only 10 pips on the first deal. Short positions should have been opened right there, but this sell signal turned out to be false and brought losses of about 40 pips. The next step was crossing the 1.2245-1.2260 area, but the price didn't manage to reach the nearest target level of 1.2329, so the deal was probably closed using Stop Loss. Two more rebounds from 1.2245-1.2260 followed, but they didn't bring any profit either. These trades were also closed by Stop Loss at breakeven. Therefore, the day wasn't very good, and the pattern was quite complex.
Trading tips on Tuesday:
GBP/USD is quite choppy on the 30-minute chart. Basically, for the last two weeks the pair has been moving between 1.2141 and 1.2329. This movement cannot be considered as a standard flat, but obviously it is not a trend either. Formally, we have an uptrend now, but it is very weak, and this week the fundamental and macroeconomic background will be so strong that the pair may "fly" from side to side every day. On the 5-minute TF on Tuesday, it is recommended to trade at the levels 1.1950-1.1957, 1.2064-1.2079, 1.2141, 1.2186-1.2205, 1.2245-1.2260, 1.2329-1.2337, 1.2371, 1.2471-1.2477. As soon as the price passes 20 pips in the right direction, you should set a Stop Loss to breakeven. On Tuesday, there will be nothing interesting in the UK, but the inflation report will be published in the US, which may provoke a strong market reaction.
Basic rules of the trading system:
1) The strength of the signal is determined by the time it took the signal to form (a rebound or a breakout of the level). The quicker it is formed, the stronger the signal is.
2) If two or more positions were opened near a certain level based on a false signal (which did not trigger a Take Profit or test the nearest target level), then all subsequent signals at this level should be ignored.
3) When trading flat, a pair can form multiple false signals or not form them at all. In any case, it is better to stop trading at the first sign of a flat movement.
4) Trades should be opened in the period between the start of the European session and the middle of the US trading hours when all positions must be closed manually.
5) You can trade using signals from the MACD indicator on the 30-minute time frame only amid strong volatility and a clear trend that should be confirmed by a trendline or a trend channel.
6) If two levels are located too close to each other (from 5 to 15 pips), they should be considered support and resistance levels.
On the chart:
Support and Resistance levels are the levels that serve as targets when buying or selling the pair. You can place Take Profit near these levels.
Red lines are channels or trend lines that display the current trend and show in which direction it is better to trade now.
The MACD indicator (14, 22, and 3) consists of a histogram and a signal line. When they cross, this is a signal to enter the market. It is recommended to use this indicator in combination with trend patterns (channels and trendlines).
Important announcements and economic reports that can be found on the economic calendar can seriously influence the trajectory of a currency pair. Therefore, at the time of their release, we recommend trading as carefully as possible or exiting the market in order to avoid sharp price fluctuations.
Beginners on Forex should remember that not every single trade has to be profitable. The development of a clear strategy and money management is the key to success in trading over a long period of time.


