


Trend analysis (Fig. 1).
The euro-dollar pair may move upward from the level of 1.0532 (closing of yesterday's daily candle) to the upper fractal at 1.0614 (yellow dotted line). When testing this level, a downward movement is possible to the 1.0561 resistance level (thick blue line).
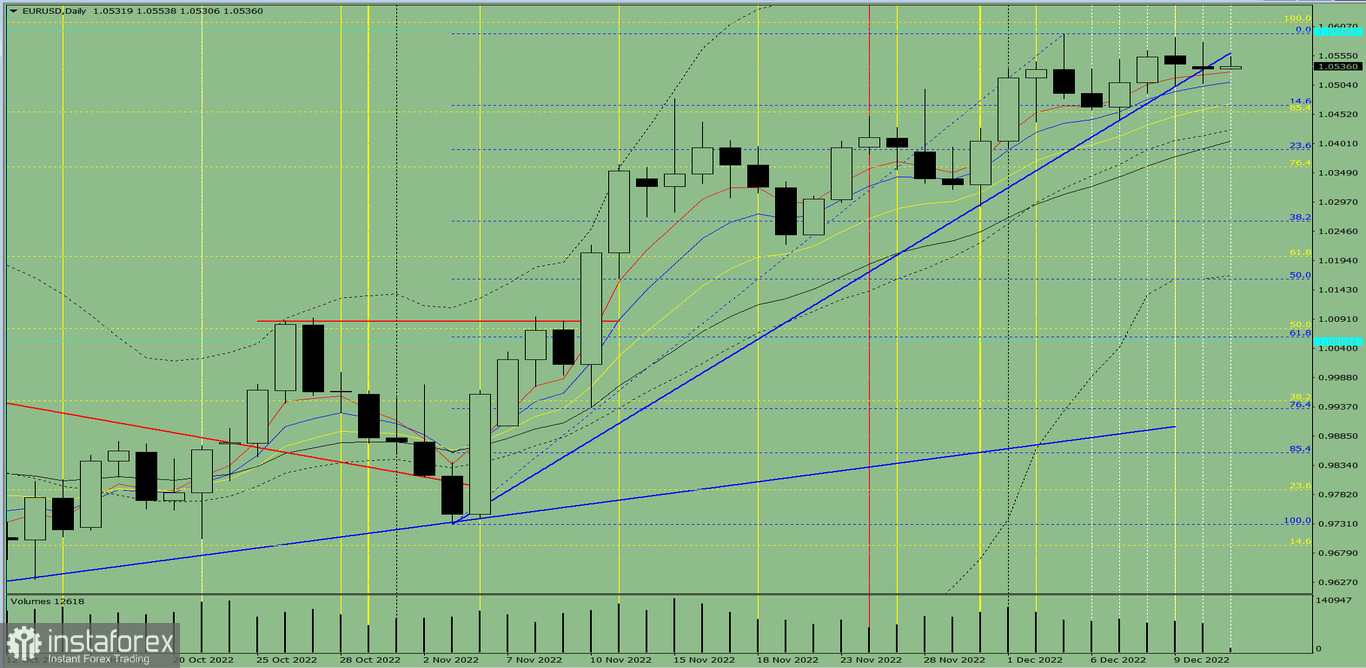
Fig. 1 (daily chart).
Comprehensive analysis:
- Indicator analysis - up;
- Volumes - up;
- Candlestick analysis - down;
- Trend analysis - up;
- Bollinger bands - up;
- Weekly chart - up.
General conclusion:
Today, the price may move upward from the level of 1.0532 (closing of yesterday's daily candle) to the upper fractal at 1.0614 (yellow dotted line). When testing this level, a downward movement is possible to the 1.0561 resistance level (thick blue line).
Alternatively, the price may move upward from the level of 1.0532 (closing of yesterday's daily candle) to the upper fractal at 1.0594 (blue dotted line). When testing this level, a downward movement is possible to 1.0467, the 14.6% retracement level (blue dotted line). From this level, the price may move up.


