


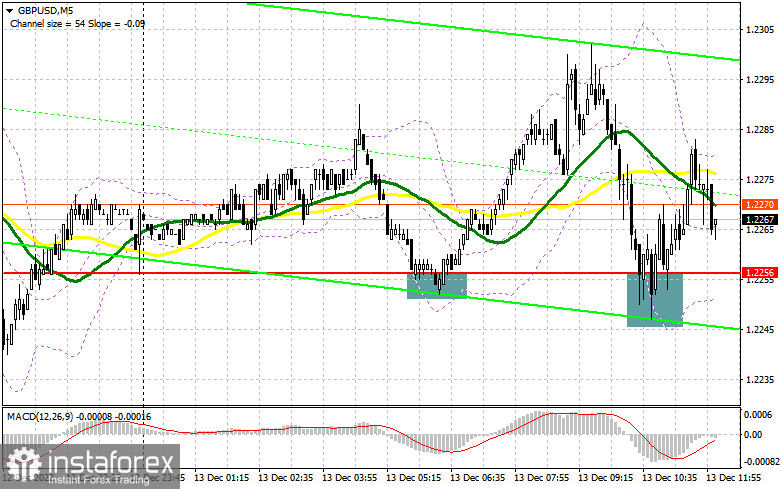
In the morning article, I turned your attention to 1.2256 and recommended making decisions with this level in focus. Now, let's look at the 5-minute chart and figure out what actually happened. A decline and a false breakout of this level created excellent entry points into long positions within the uptrend. The pair went up by about 45 pips. Closer to the middle of the day, another breakout of 1.2256 took place, which also gave a buy signal. However, the pair rose only by 30 pips. For the afternoon, the technical outlook has not been revised.
When to open long positions on GBP/USD:
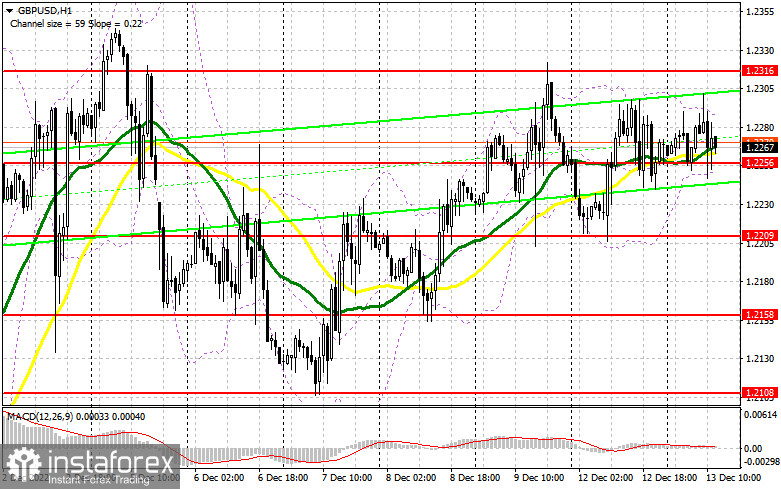
Traders are now looking forward to the US inflation report. If inflation climbs, it will spur demand for the US dollar. The pound sterling, on the contrary, will decline to the support level of 1.2256. This level has already been tested today two times. For this reason, I shifted attention from this level. In case of a sharp drop in the pound sterling, it is better to wait for a false breakout of 1.2209. If this scenario comes true, it will provide new buying opportunities with the prospect of an increase to 1.2316. A breakout and a downward retest of this level will stimulate the bullish momentum and give a new buy signal. If so, the pair could approach a December high of 1.2367. A more distant target will be the 1.2367 level where I recommend locking in profits. If the bulls fail to push the pair to 1.2209, the pressure on the pair will escalate. The bears will definitely take advantage of the situation. Hence, the price may take a nosedive to 1.2158. In this case, I would advise you to open long positions only if a false breakout takes place. You could buy GBP/USD at a bounce from 1.2108 or lower at 1.2057, keeping in mind an upward intraday correction of 30-35.
When to open short positions on GBP/USD:
Sellers have tried several times to regain control. However, their attempts were fruitless. apparently, the majority of investors are betting on a decline in the CPI in November this year. If so, the pound sterling is sure to resume its November rally. Therefore, apart from taking control of 1.2256, bears need to protect 1.2316. Only a false breakout of this level will provide an excellent entry point into short positions with the prospect of a decrease to 1.2256, the middle of the sideways channel. A breakout of this level after a strong report could easily take place. However, only an upward retest of this level will give an additional sell signal, undermining a bullish bias. The price is likely to tumble to 1.2209. At this level, sellers will again face certain difficulties. A breakout and an upward retest will open the way to a more distant target level of 1.2158 where I recommend locking in profits. If the price does not decline to 1.2316, it may climb above the monthly highs, which will lead to a breakout of 1.2367. A false breakout there will create an entry point into short positions with a high probability of a further drop. If bears show no energy there, you could sell GBP/USD at a bounce from 1.2410, keeping in mind a downward intraday correction of 30-35.
COT report
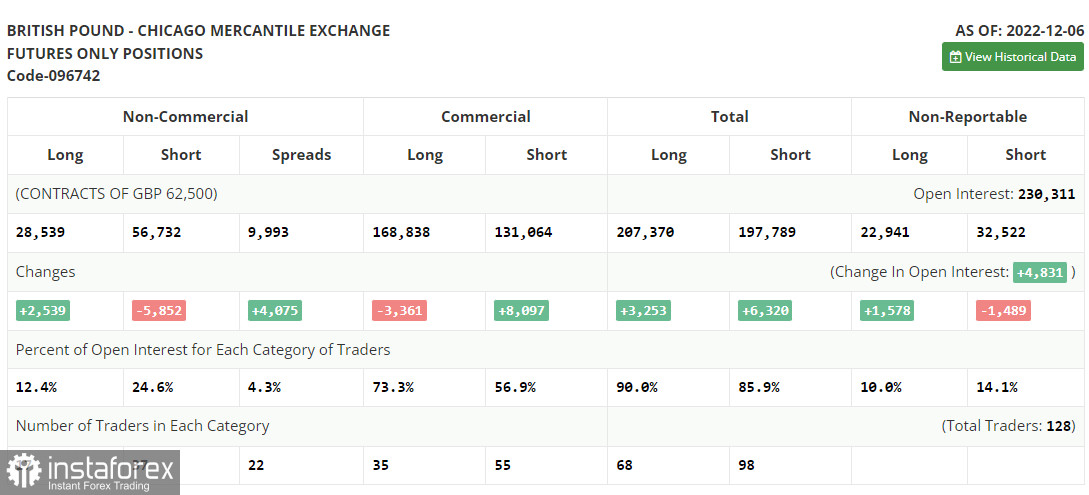
The COT report (Commitment of Traders) for December 6 logged an increase in long positions and a drop in short ones. Apparently, GBP bulls are confident that the uptrend will persist as the Fed is widely expected to shift to a less hawkish stance. It means that the rate gap between the BoE and the Fed could narrow in the near future. However, the UK Business activity data released last week turned out to be rather disappointing. It clearly indicated a looming recession in the economy. The UK GDP report was slightly better than expected. However, the third straight month of a contraction in economic activity confirms growing recession concerns. Given that the Bank of England is strongly committed to taming inflation and raising the interest rate, the economic prospects are rather grim. It explains why traders are cautious when buying the instrument despite the short-term uptrend. According to the latest COT report, short non-commercial positions dropped by 5,852 to 56,732 and long non-commercial positions grew by 2,539 to 2,8539. Consequently, the non-commercial net position came in at -28,193 versus -36,584 a week ago. The weekly closing price of GBP/USD grew to 1.2149 against 1.1958.
Indicators' signals:
Trading is carried out near the 30 and 50 daily moving averages, which indicates market uncertainty.
Moving averages
Note: The period and prices of moving averages are considered by the author on the H1 (1-hour) chart and differ from the general definition of the classic daily moving averages on the daily D1 chart.
Bollinger Bands
If GBP/USD drops, the indicator's lower border at 1.2250 will serve as support.
Description of indicators
- Moving average (moving average, determines the current trend by smoothing out volatility and noise). Period 50. It is marked yellow on the chart.
- Moving average (moving average, determines the current trend by smoothing out volatility and noise). Period 30. It is marked green on the chart.
- MACD indicator (Moving Average Convergence/Divergence - convergence/divergence of moving averages) Quick EMA period 12. Slow EMA period to 26. SMA period 9
- Bollinger Bands (Bollinger Bands). Period 20
- Non-commercial speculative traders, such as individual traders, hedge funds, and large institutions that use the futures market for speculative purposes and meet certain requirements.
- Long non-commercial positions represent the total long open position of non-commercial traders.
- Short non-commercial positions represent the total short open position of non-commercial traders.
- Total non-commercial net position is the difference between the short and long positions of non-commercial traders.


