


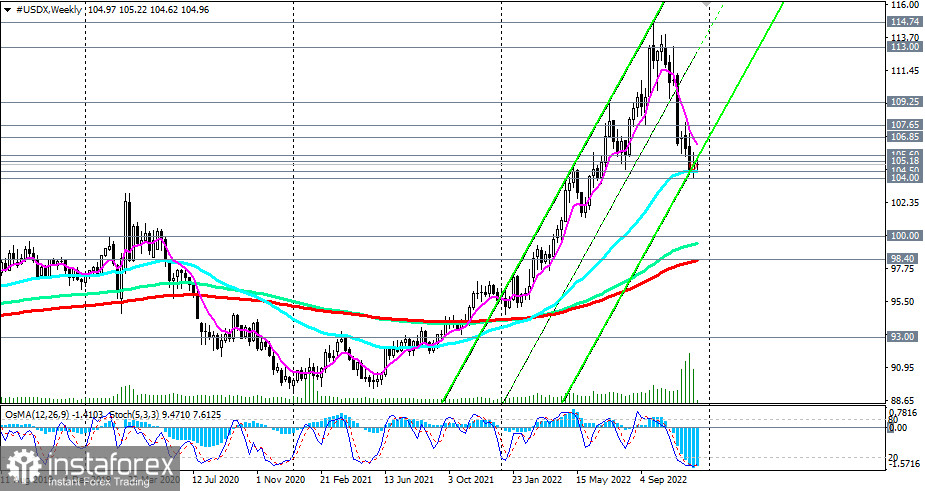
The first signal for new short positions will be a breakdown of the local support and 50 EMA on the weekly chart of the DXY (CFD #USDX in MT4), passing through 104.50, and its confirmation will be a breakdown of the "round" support at 104.00.
Its breakdown may significantly worsen the prospects for the dollar and its DXY index, moving them into the bear market zone and sending them towards support levels 100.00, 99.00.
A breakdown of the 98.40 key support level (200 EMA on the weekly chart) will finally break the bullish trend of DXY.
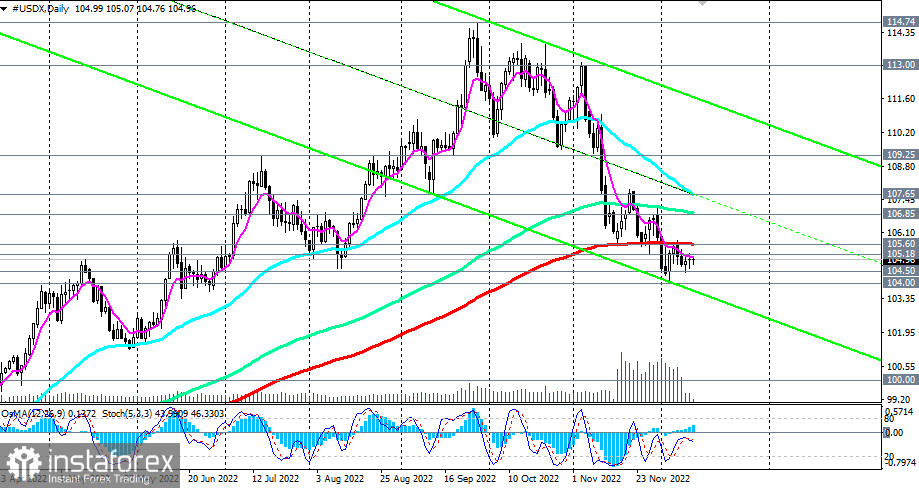
Alternatively, to resume the DXY bullish trend, prices need to break through to the area above the resistance levels 106.85 (144 EMA on the daily chart), 107.65 (50 EMA on the daily chart). The breakdown of 105.18 (200 EMA on the H1 chart), 105.60 (200 EMA on the D1 chart) resistance levels will be the first signal for the development of this scenario.
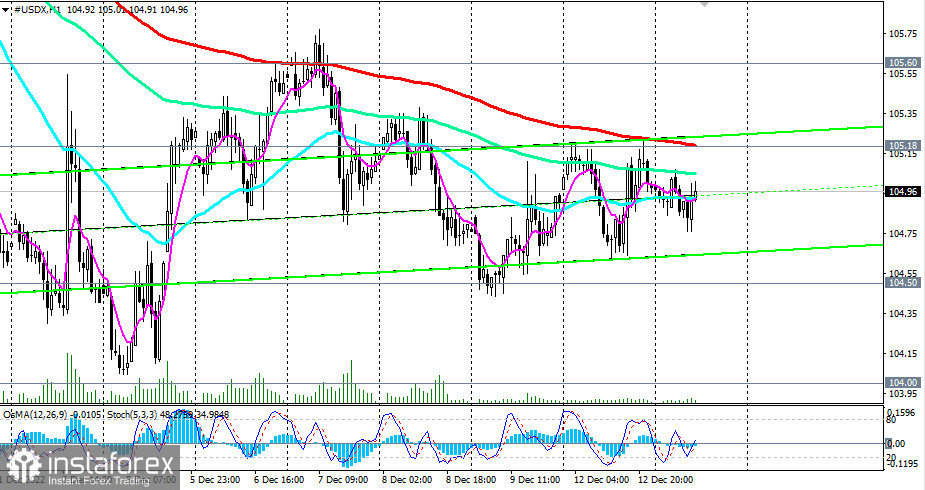
In the meantime, short positions remain preferable even below the 105.60 resistance level.
Support levels: 105.00, 104.50, 104.00
Resistance levels: 105.18, 105.60, 106.85, 107.65, 108.00, 109.00, 109.25, 110.00, 111.00, 113.00
Trading Tips
Sell Stop 104.40. Stop Loss 105.40. Take Profit 104.00, 103.00, 102.00, 100.00
Buy Stop 105.40. Stop-Loss 104.40. Take-Profit 105.60, 106.85, 107.65, 108.00, 109.00, 109.25, 110.00, 111.00, 113.00


