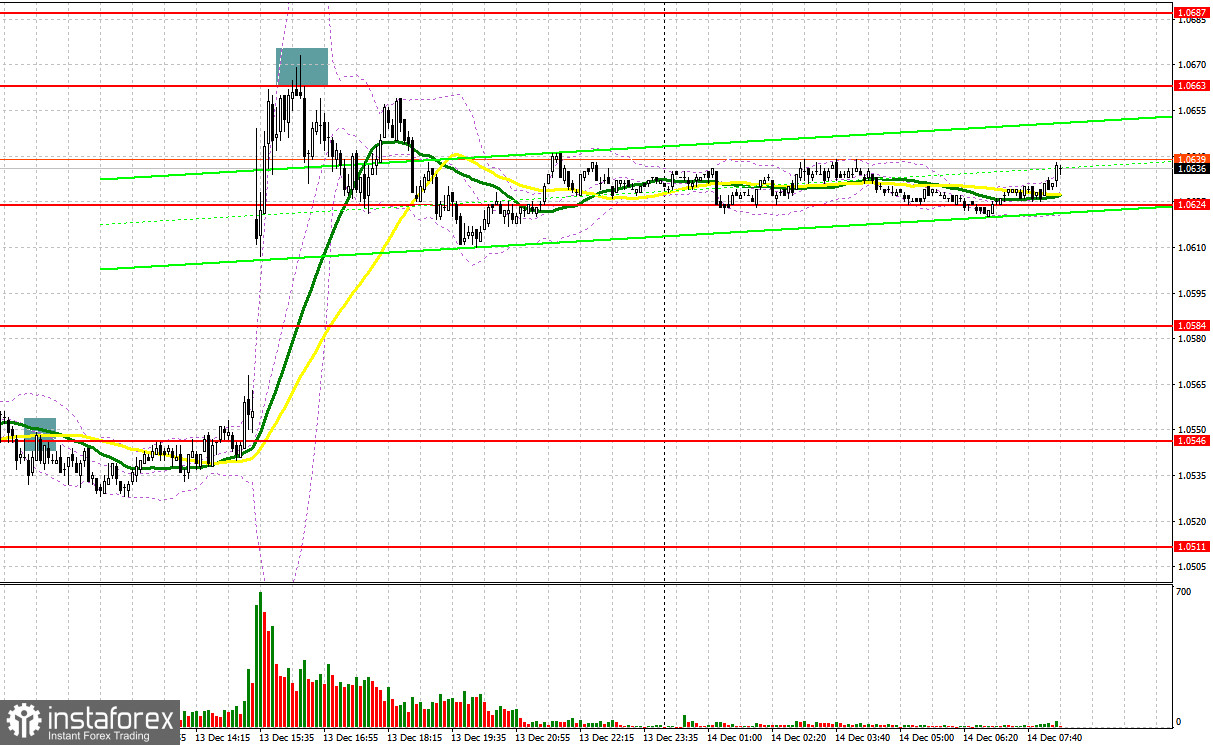
There were several entry signals yesterday. Let us have a look at the 5-minute chart and figure out what happened. In my morning forecast, I highlighted the level of 1.0546 and recommended making market entry decisions with this level in mind. The pair broke above 1.0546 and performed an upward test of this level in the first half of the day. As a result, a sell signal was created. However, EUR/USD moved down by about 20 pips. The latest US inflation data led to a EUR upsurge towards the resistance at 1.0663. The pair bounced off this level and moved down about 40 pips afterwards.

When to open long positions on EUR/USD:
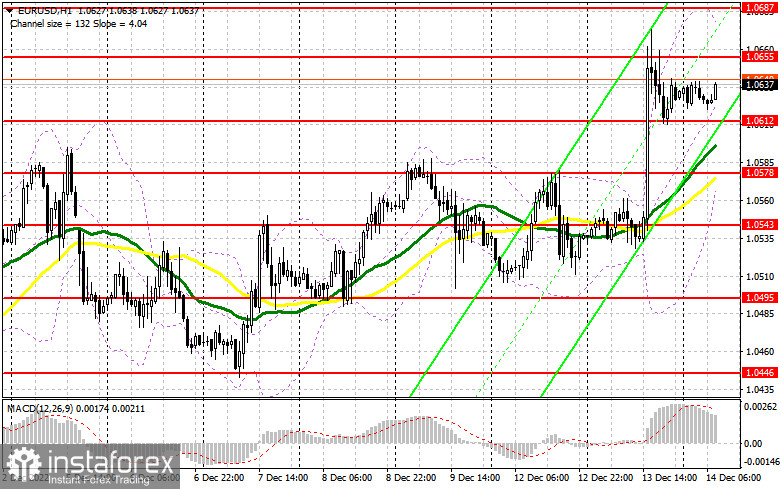
EUR went up after the release of US inflation data for November yesterday. Inflationary pressure has eased significantly, which will allow the Fed to continue with its plan to return to a less aggressive monetary policy. There are no important data releases in the second half of the day. EUR may try to return to yesterday's highs. However, any further upward movement can only occur after the Fed policy meeting today. The eurozone industrial output report for October is not particularly significant. The best opportunity for opening long positions today is a false breakout of the closest support level of 1.0612. This will create a buy signal and allow bulls to push the pair higher towards the resistance level of 1.0655, which formed during yesterday's trading session. A breakthrough and a downward retest of this level will create an additional entry point with 1.0687 being the target. However, hitting higher levels will only be possible if EUR/USD breaks above 1.0687, which will trigger the stop-loss orders of bears and create another buy signal. Afterwards, EUR/USD may jump to 1.0714, where I recommend taking profits. If the pair moves down and bulls are inactive at 1.0612, it will increase pressure on EUR/USD ahead of the Fed meeting and result in a slight downward correction. A breakthrough below 1.0612 will push EUR/USD towards the next support level of 1.0578. The moving averages located in this area favor bullish traders. Going long on EUR/USD in this situation is only recommended during a false breakout. You can sell EUR/USD immediately if it bounces off 1.0543 or 1.0495, keeping in mind an upward intraday correction of 30-35 pips.
When to open short positions on EUR/USD:
Bearish traders will probably wait for the pair to hit yesterday's highs. Only then they will become more active. For this reason, the best opportunity for going short on EUR/USD at this point is a false breakout of 1.0655. It will push the pair down to the support level of 1.0612, which was formed yesterday and which will be a key level today. A breakout and a retest of this range will create an additional sell signal. The pair may move towards 1.0578 afterwards. If EUR/USD consolidates below this range it will trigger a significant downside movement to 1.0543, but it will happen only if the Fed chairman gives a hawkish statement, which is highly unlikely. It will also make a EUR bearish trend possible. The most distant target is 1.0495, where I recommend taking profits. If EUR/USD advances during the European session and bears are inactive at 1.0655, the pair will jump towards 1.0687, a new monthly high. I also suggest opening short positions there only if EUR/USD fails to settle there. You can sell EUR/USD immediately if it bounces off the high of 1.0714, targeting a downward correction of 30-35 pips.

COT report:
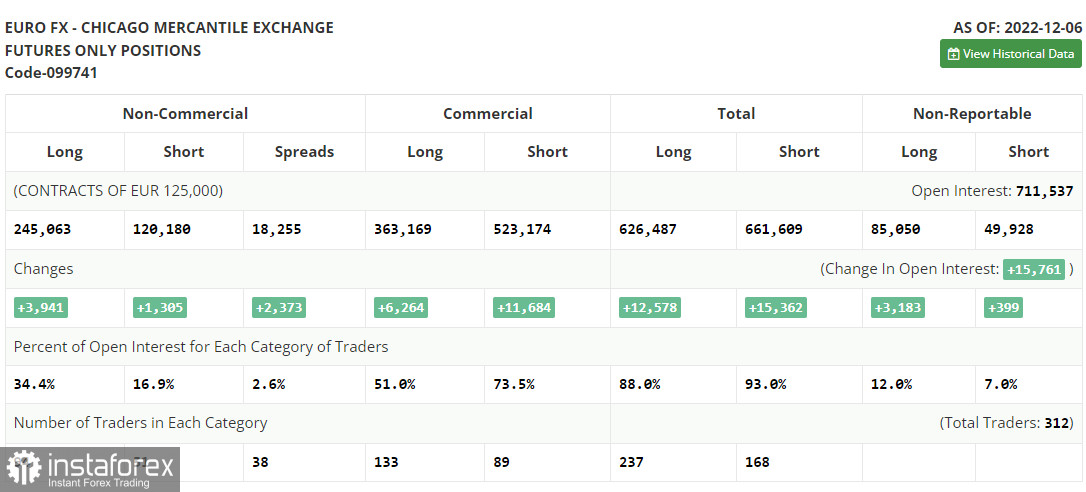
The COT report (Commitment of Traders) for December 6 indicated that both long and short positions increased. Strong US activity data managed to counterbalance a similarly strong Q3 Eurozone GDP data. The EU report was revised upwards, keeping demand for risky assets unchanged. However, the situation is likely to change this week as US inflation data in November may exceed expectations, which should dramatically upset the market once again. Later today, the FOMC meeting is due to take place. Fed chairman Jerome Powell may shift his tone to a more hawkish one, which will give support to the US dollar. If inflation continues to decline, the euro could be expected to make a larger upsurge by the end. The COT report indicated that long non-commercial positions rose by 3,941 to 245,063, while short non-commercial positions jumped by 1,305 to 120,180. At the end of the week, total non-commercial net positioning increased slightly to 123,113 versus 122,234. This indicates that investors are still optimistic and are willing to keep buying the euro at current levels. They only need a new fundamental trigger to do so. The weekly closing price decreased to 1.0315 versus 1.0342.

Indicators' signals:
Moving averages
Trading is carried out above the 30-day and 50-day moving averages, which indicates that the market is becoming more bullish.
Note: The period and prices of moving averages are considered by the author on the H1 (1-hour) chart and differ from the general definition of the classic daily moving averages on the daily D1 chart.
Bollinger Bands
If the pair moves up, the upper band of the indicator at 1.0687 will serve as resistance. If EUR/USD declines, the lower band of the indicator at 1.0578 will provide support.
• Moving average (moving average, determines the current trend by smoothing out volatility and noise). Period 50. It is marked yellow on the chart.
• Moving average (moving average, determines the current trend by smoothing out volatility and noise). Period 30. It is marked green on the chart.
• MACD indicator (Moving Average Convergence/Divergence - convergence/divergence of moving averages) Quick EMA period 12. Slow EMA period to 26. SMA period 9
• Bollinger Bands (Bollinger Bands). Period 20
• Non-commercial speculative traders, such as individual traders, hedge funds, and large institutions that use the futures market for speculative purposes and meet certain requirements.
• Long non-commercial positions represent the total long open position of non-commercial traders.
• Short non-commercial positions represent the total short open position of non-commercial traders.
• Total non-commercial net position is the difference between the short and long positions of non-commercial traders.


