Macroeconomic calendar on December 20
Tuesday's macroeconomic calendar was not much different from Monday's one. It was bereft of any important releases from Europe and the UK. Meanwhile, the United States published data on the housing market, which reflected big problems in this sector of the economy.
US building permits fell by 11.2% in November, notching the biggest decline since the beginning of the year. At the same time, housing starts decreased by 0.5% in November.
As a result, the US dollar slowed down its upward cycle.
Overview of trading charts on December 20
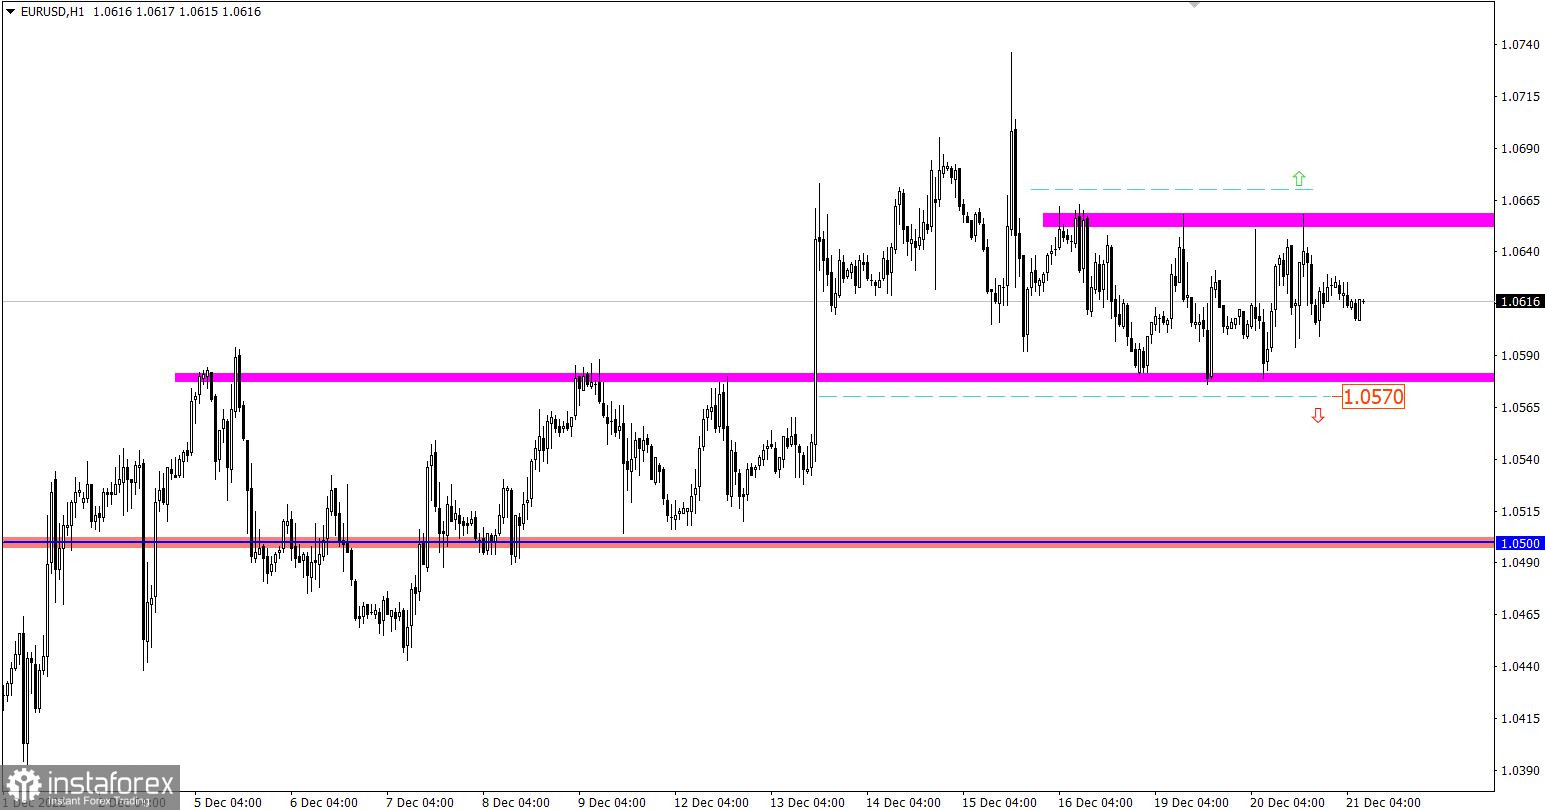
The EUR/USD pair has been moving within the sideways range of 1.0580/1.0660 for the third consecutive day, which indicates an accumulation process. Most likely, the current stagnation will trigger fresh momentum in the market.
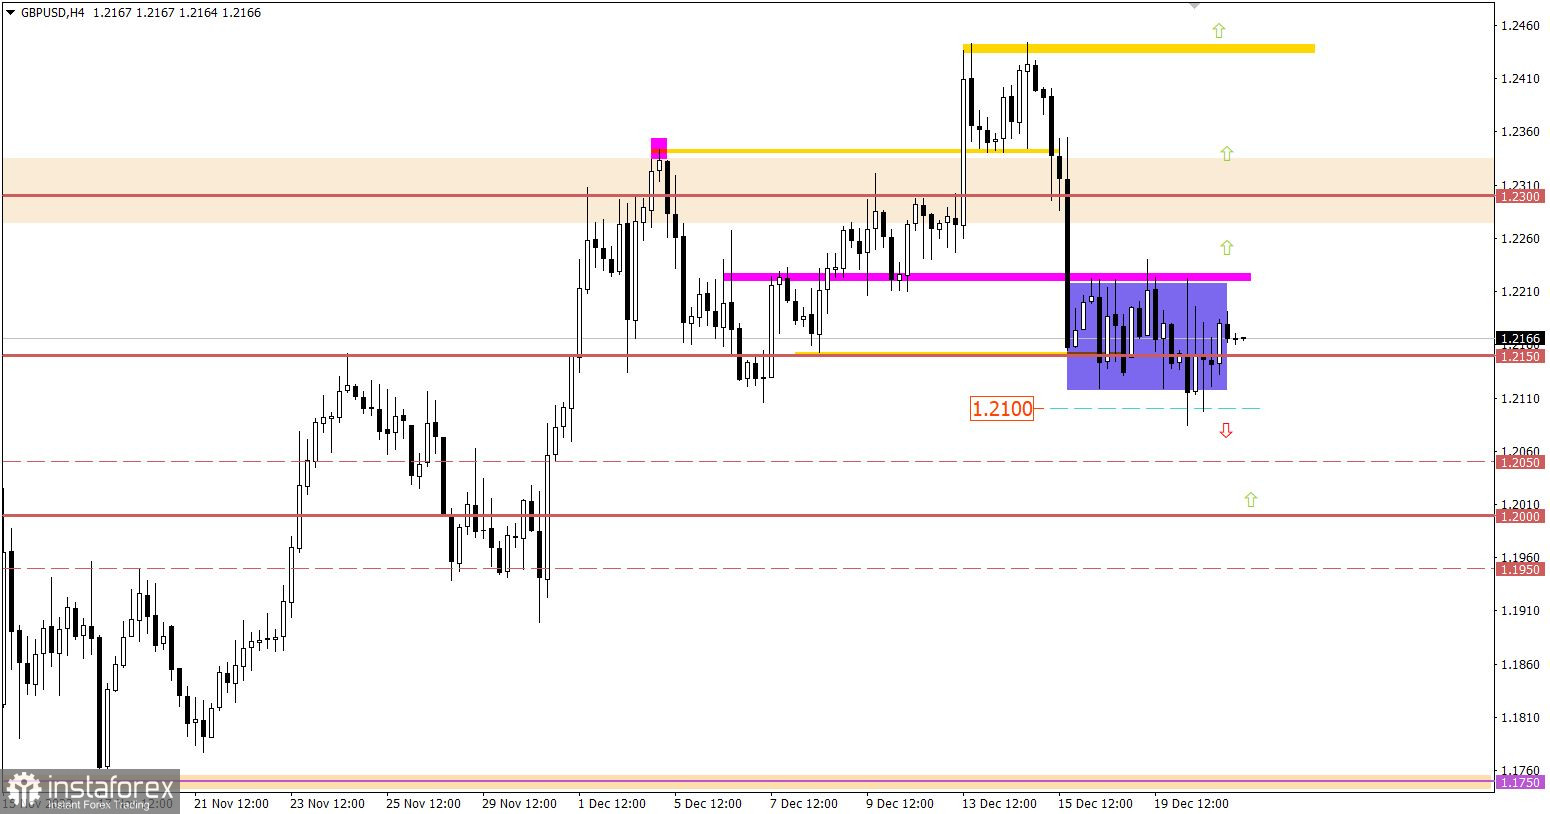
Meanwhile, the GBP/USD pair is also trading sideways around the level of 1.2150. Notably, there are many Doji candles on the four-hour chart, which indicates clear uncertainty over its further movement among market participants. At the same time, this movement can be classified as an accumulation process, which may force the price to gain strong momentum and get out of the range.

Macroeconomic calendar on December 21
For the third day in a row, the macroeconomic calendar has been almost bereft of any important releases.
The only thing traders may take notice of is US existing home sales, which are forecast to have declined in November.
Time targeting
US Existing Home Sales (Nov)
EUR/USD trading plan for December 21
Based on the successive cycles in the given range, it can be assumed that the price may gain momentum and get out of the range. The best tactic is to trade with a view to breaking through one or another range boundary, waiting for confirmation on the four-hour chart.
Conclusion:
A bullish scenario will be considered by traders if the price consolidates above 1.0670 on the four-hour chart. In this case, the volume of long positions will increase, and the price may rise above the local high of the upward cycle.
A bearish scenario will be relevant if the price fixes below 1.0570 on the four-hour chart. In this case, the price is expected to return to the area of 1.0500.

GBP/USD trading plan for December 21
The sideways range is limited by the levels of 1.2100 and 1.2230. To get out of the range, the quote needs to break through one or another range boundary on the four-hour chart. In this case, there will be an increase in the volume of trading positions in the direction of a breakout.
Conclusion:
A bullish scenario will be considered by traders if the price consolidates above 1.2230 on the four-hour chart. This move will lead to an increase in the volume of long positions, and the pair will head towards 1.2300-1.2350.
A bearish scenario will be relevant if the price fixes below 1.2100 on the four-hour chart. In this case, the price is expected to return to the psychological level of 1.2000.

What's on trading charts
The candlestick chart shows graphical white and black rectangles with lines from above and below. While conducting a detailed analysis of each individual candlestick, one can notice its features intrinsic to a particular time frame: the opening price, the closing price, as well as the highest and lowest prices.
Horizontal levels are price levels, at which the price may stop or reverse. They are called support and resistance levels.
Circles and rectangles are highlighted examples where the price reversed in the course of its history. This color highlighting indicates horizontal lines, which can exert pressure on the quote in the future.
Up/down arrows signal a possible future price direction.
Traders are recommended to read the following article:
EUR/USD and GBP/USD: trading plan for beginners on December 20


