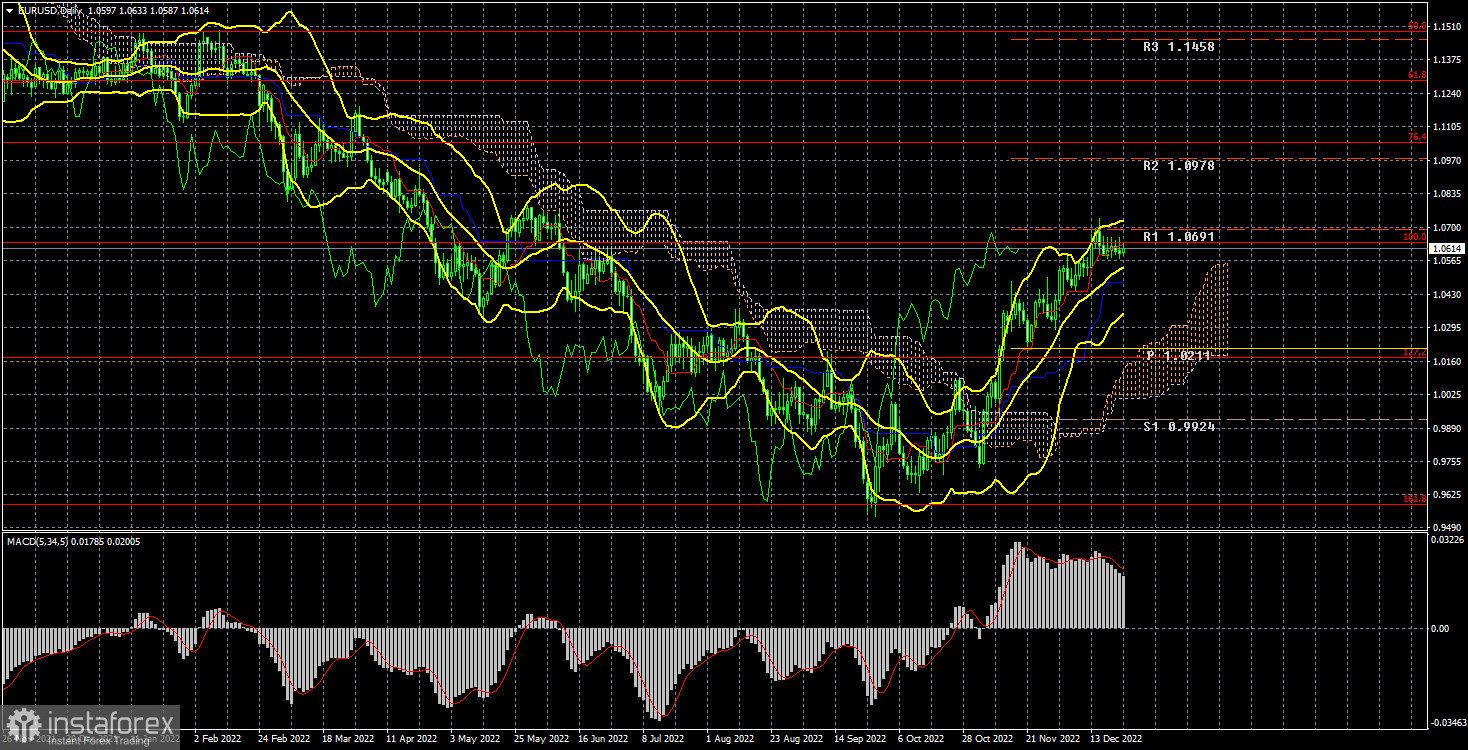
Long-term outlook.

This week, the EUR/USD currency pair has only displayed one thing: an absolute flat. Since Catholic Christmas is being observed this weekend and there is still about a week until the New Year, this movement should not come as much of a surprise. Therefore, it is quite understandable why the market is passive. But at the same time, we also observed that the pound sterling was trading quite briskly. Our confusion is caused by the movements of the two major pairs not correlating. Given that the fundamental and macroeconomic backgrounds this week were essentially the same for both pairs, we won't try to speculate as to why this occurred. They were practically absent, to be more precise. Therefore, if we discuss movement logic, the euro has done better in this regard.
Naturally, the technical situation has not changed given the lack of movement. The pair on the 24-hour TF is still above all of the Ichimoku indicator's lines, so it is still in an upward trend. You can only trade the pair on the lower TF right now because the price isn't currently rising or falling. We still anticipate a downward correction following the recent strong growth, but it is currently unclear when the pair will emerge from the flat and resume moving in the direction of the trend. We continue to hold the view that there are no justifications or grounds for further expansion of the euro. The likelihood of the US dollar strengthening in the near future appears to be increasing.
COT evaluation.
The recent COT reports on the euro currency are entirely consistent with market activity. The aforementioned illustration makes it abundantly clear that since the start of September, the net position of major players (the second indicator) has been improving. At about the same time, the value of the euro started to increase. Although non-commercial traders' net positions are currently "bullish" and improving almost weekly, it is the relatively high value of the "net position" that now enables the impending completion of the upward movement. The first indicator, where the red and green lines are very far apart, which frequently denotes the end of the trend, signals this. The number of buy-contracts from the non-commercial group increased by 12.7 thousand during the reporting week, while the number of short positions decreased by 4.8 thousand. The net position consequently increased by 7.9 thousand contracts. For non-commercial traders, there are currently 143 thousand more buy contracts than sell contracts. What remains to be seen is how much longer the major players will increase their long positions. This process, in our opinion, cannot go on for another two or three months. You need to "discharge" a bit, or adjust, even based on the net position indicator. Sales are 43 thousand more if we look at the overall indicators of open longs and shorts for all categories of traders (684 vs. 641k).
Examination of fundamental occurrences
This week in the European Union, there was not a single significant event. The two speeches by ECB Vice Chairman Luis de Guindos, who stated that he did not know to what level the rate would rise or how long the tightening of monetary policy would continue, could generate the most interest in an empty calendar. As a result, his speech did not provide traders with any new information. In the United States, the third quarter's GDP report (which was different from the first two) was released in the final estimate. The American economy grew by 3.2%, not the expected 2.9%, but this news had no impact on the market's mood. Because the pound/dollar pair was trading extremely actively and even engaged in practicing macroeconomic publications at the same time, it appears that the market made the decision to avoid trading the euro/dollar pair at the very beginning of the week and stuck to the chosen plan.
1) On the 24-hour timeframe, the pair is located above all of the Ichimoku indicator's lines, giving it a good chance of continuing to rise. This is the trading strategy for the week of December 26 to December 30. Of course, if geopolitics begins to deteriorate once more, these chances could disappear very quickly, but for now, we can confidently anticipate an upward movement with a target of 1.1040 (76.4% Fibonacci) and cautiously buy the pair. Meanwhile, a significant downward correction could start at any time.
2) The sales of the euro/dollar pair are no longer significant. You should now wait for the price to return below the important Ichimoku indicator lines before thinking about shorting. There are currently no circumstances in which the US dollar can reverse the current trend. However, in the modern world, anything can happen at any time.
Explanations for the illustrations:
Fibonacci levels, or levels that are targets when beginning purchases or sales, are price levels of support and resistance (resistance/support). Take Profit levels may be positioned close by.
Bollinger Bands, MACD, and Ichimoku indicators (standard settings) (5, 34, 5).
The net position size of each trading category is represented by indicator 1 on the COT charts.
The net position size for the "Non-commercial" group is represented by indicator 2 on the COT charts.


