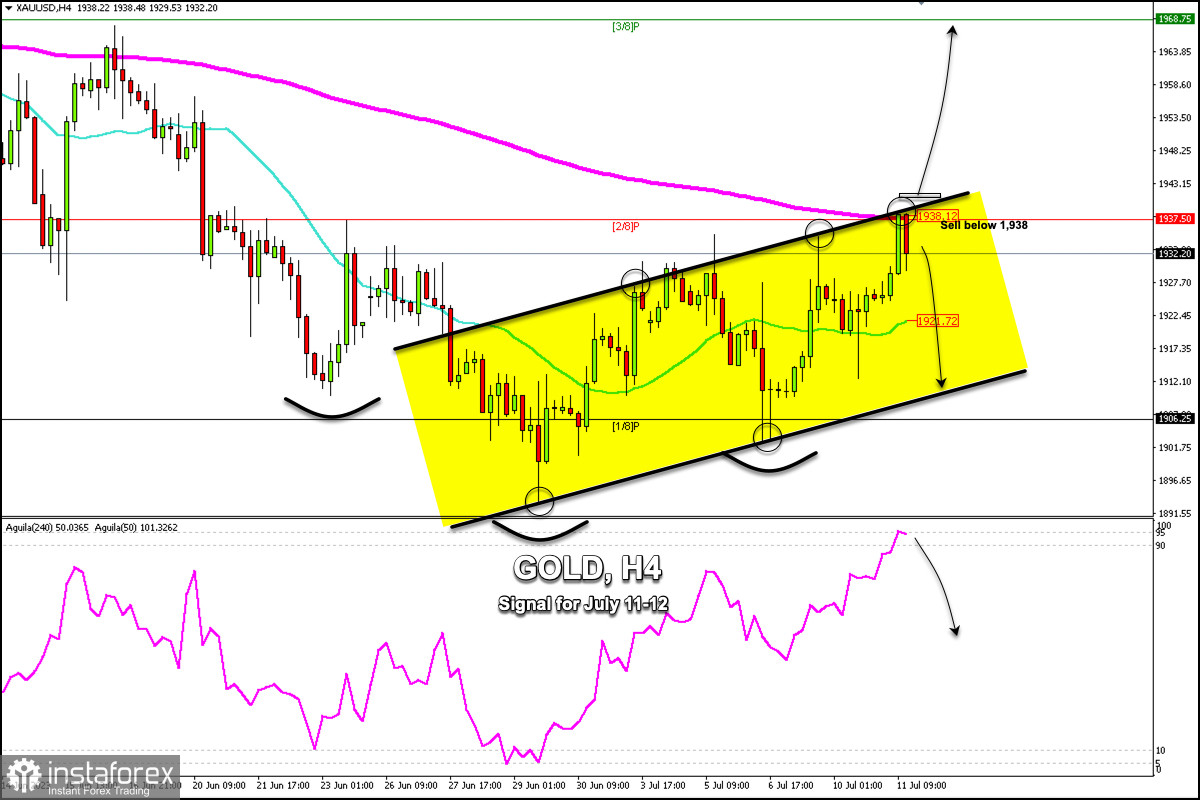
Gold (XAU/USD) is trading around 1,932.20 below the 200 EMA and below the 2/8 Murray. Gold is correcting, having reached 1,938.48. In the next few hours, it is expected to continue falling and the price could reach the 21 SMA around 1,921.
According to the 4-hour chart, we can observe the formation of an inverted head&shoulders pattern. If gold breaks above 1,940, the signal of this pattern could be confirmed and we could expect the price to reach the zone of 1,968 (3/8 Murray) and could even reach the psychological level of $2,000.
However, the 4-hour chart shows that gold is overbought and we could expect a technical correction in the next few hours towards the 1,920 level. the instrument could even reach the bottom of the uptrend channel around 1,912.
US inflation data will be released tomorrow which will trigger strong volatility. So, the metal could make a strong move bullish if the data is favorable for the US. Alternatively, if the data is negative, gold might fall and reach the level of 1,906 (1/8 Murray).
The 4-hour chart shows that gold is trading within an uptrend channel formed since June 27 and is expected to continue moving within it in the coming days. Only a sharp break could change the trend of gold.
A daily close below 1,910 and below 1/8 Murray (1,906) could mean an acceleration of the move lower and the instrument could reach the low of June 29 at 1,892.99 and even fall towards 0/8 Murray located at 1,875.


