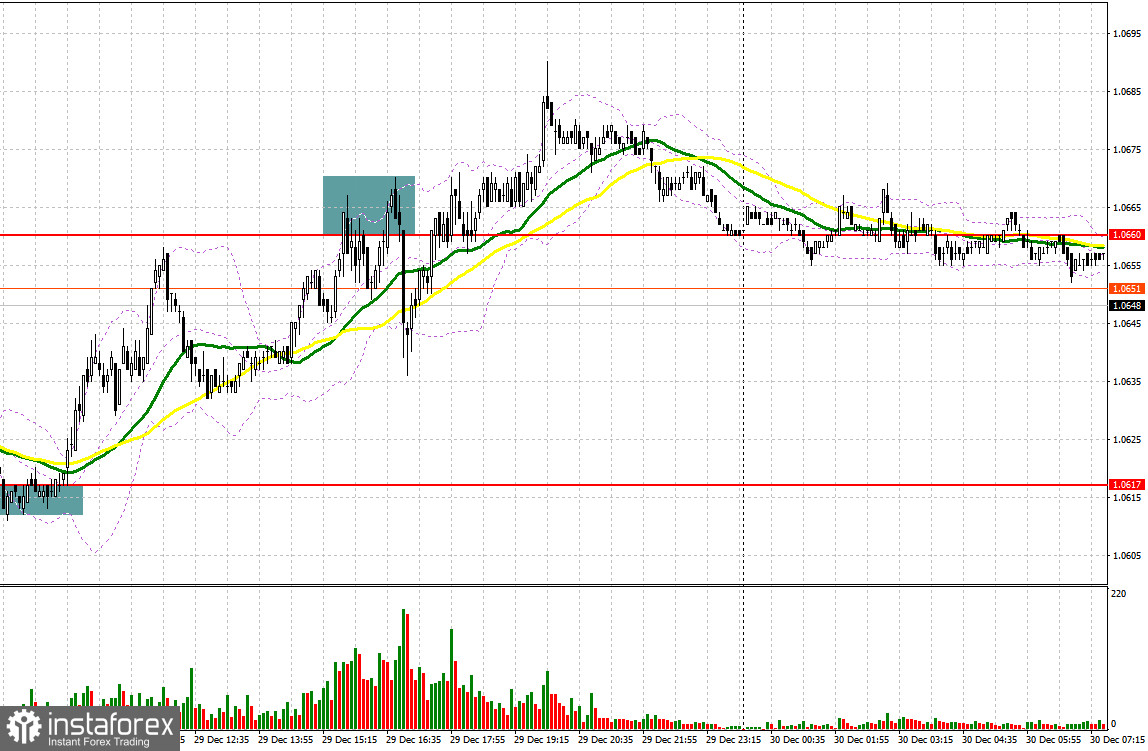
There were some intriguing hints in the market yesterday. Let's analyze the 5-minute chart to see what transpired. I focused on the 1.0617 level in my morning forecast and suggested making considerations about joining the market there. Due to a lack of news during the days leading up to the holiday and minimal volatility, the decline and construction of a false breakdown towards the middle of the 1.0617 channel gave us a great entry point for buying the euro. The pair increased by more than 30 points as a result. Sellers were more active during the test of 1.0660 in the afternoon, which resulted in a false collapse and a sell signal. However, the decline was only about 25 points.

To open long positions on EUR/USD, you need:
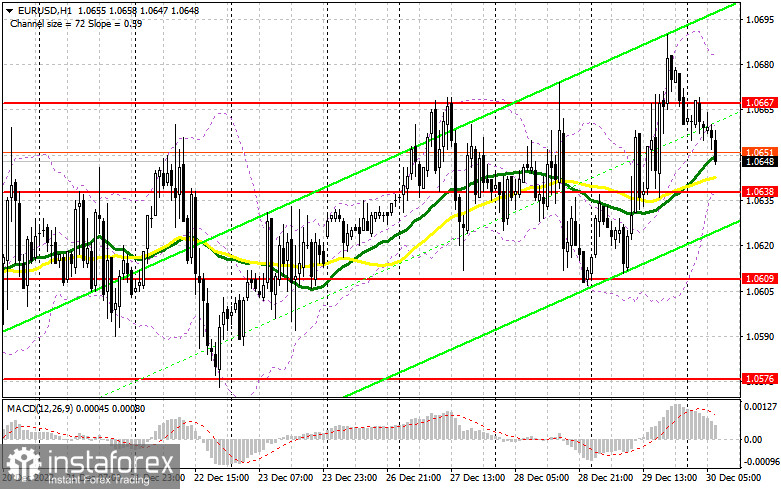
Due to the pre-holiday rush and the short trading day today, I anticipate low trading volume and the same volatility. Given that there is no European news for today, it is expected that a battle for the side channel's middle will take place in the region of 1.0638, where the moving averages are also favoring the bulls. The best scenario for buying will be a decrease and the emergence of a fake breakdown in this region, which, similar to yesterday, will signal a buying opportunity and enable the bulls to return to the level of 1.0667. An additional entry point for establishing long positions with a jerk up to a maximum of 1.0703 is formed by a breakout and top-down test of this range. The creation of a new upward trend towards the end of the year would be signaled by a test of 1.0741, which would indicate a collapse of this level, which would also hit the stop orders for the bears. There, I advise fixing profits. The pressure on the pair will resume if EUR/USD weakens and there are no buyers around 1.0638, resulting in a negative movement to 1.0609. I suggest that you only start long positions if there is a false breakdown. On recovery from 1.0576 or even lower, around 1.0535, you can purchase EUR/USD right away with the hope of an upward correction of 30-35 points within a day.
To open short positions on EUR/USD, you need:
Yesterday, sellers continued to trade below 1.0660, giving them a chance to predict a decline in the euro before the year's end. If the pair increases during the European session, it will be clear that 1.0667 will remain in control until the end of the year because doing otherwise could cause the euro to spike higher and trigger a new set of December highs. As a result, the best-case scenario for a sale will be a failed attempt to consolidate above 1.0667, analogous to yesterday's signal, which I studied above, and which will result in movement to the region of the 1.0638 channel's center. The euro will come under pressure again if this range is broken and reversed again, which will trigger a second sell signal and a decline to 1.0609, where the bears will undoubtedly retreat once more. The area of 1.0576 will have a more dramatic decline if consolidation occurs below this range. It will also revive hopes of creating a bear market for the euro by year's end. The region around 1.0535 will be the farthest target, and that's where I suggest fixing earnings. If the EUR/USD rises during the European session and there are no bears around 1.0667, I suggest delaying short positions until 1.0703. There, I suggest that you only sell after a failed consolidation. It is possible to sell EUR/USD right away on a recovery from the high of 1.0741 with the objective of a 30-35 point reversal to the downside.


Signals from indicators
Moveable Averages
Trading occurs around the 30 and 50-day moving averages, which highlights the market's lateral nature.
Notably, the author considers the time and prices of moving averages on the hourly chart H1 and departs from the standard definition of the traditional daily moving averages on the daily chart D1.
Bands by Bollinger
The indicator's upper bound in the vicinity of 1.0685 will serve as resistance in the event of expansion. The indicator's lower limit, which is located at 1.0638, will serve as support in the event of a downturn.
Description of indicators
- Moving average (moving average determines the current trend by smoothing out volatility and noise). Period 50. The graph is marked in yellow.
- Moving average (moving average determines the current trend by smoothing out volatility and noise). Period 30. The graph is marked in green.
- MACD indicator (Moving Average Convergence / Divergence - moving average convergence/divergence) Fast EMA period 12. Slow EMA period 26. SMA period 9
- Bollinger Bands (Bollinger Bands). Period 20
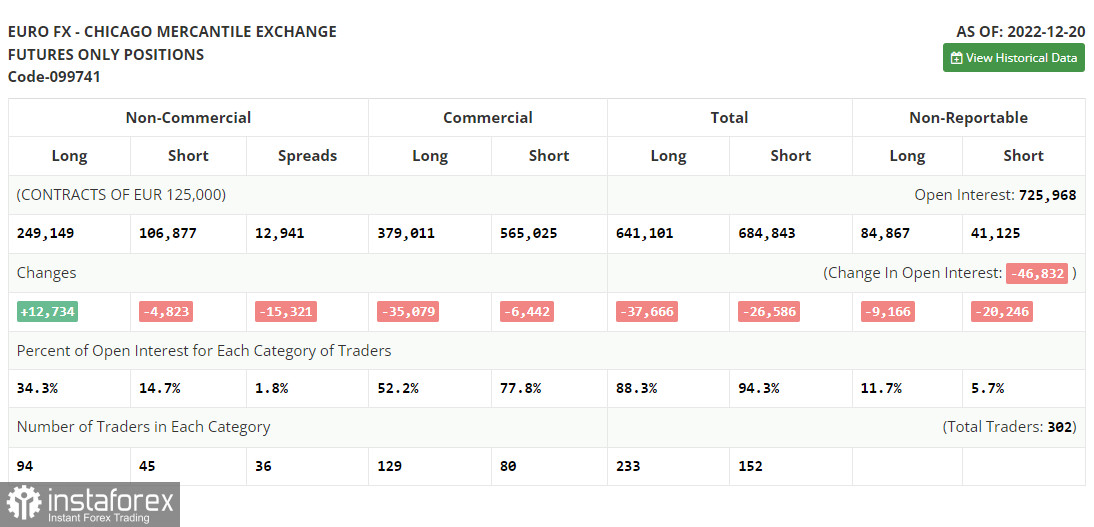
- Non-profit speculative traders, such as individual traders, hedge funds, and large institutions use the futures market for speculative purposes and to meet certain requirements.
- Long non-commercial positions represent the total long open position of non-commercial traders.
- Short non-commercial positions represent the total short open position of non-commercial traders.
- Total non-commercial net position is the difference between the short and long positions of non-commercial traders.


