


Analyzing Tuesday's trades:
EUR/USD on 30M chart
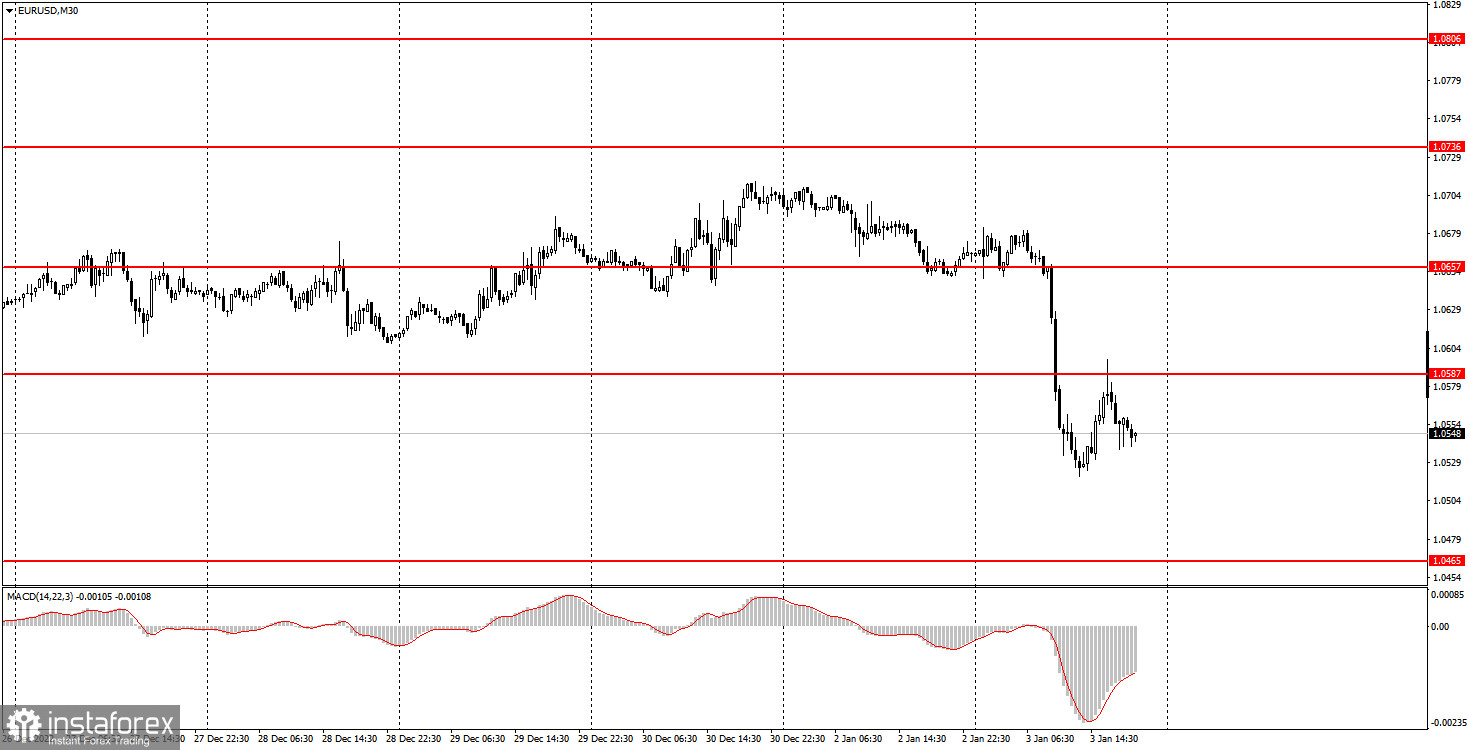
EUR/USD was too "tired" to celebrate and sharply restored its usual levels of volatility on Tuesday. After several weeks of a flat, the pair fell sharply down by almost 150 pips, crossing the lower limit of the horizontal range. Therefore, we may now officially consider the end of the flat. It is rather difficult to say why the pair resumed such a strong movement on Tuesday. There were only two reports, which theoretically could provide such a strong influence on EUR/USD. These are inflation in Germany and business activity index in the manufacturing sector in the US. However, the results of the activity index turned out to be lower than the previous one, so it is unlikely that it could have triggered a rise in the USD. Meanwhile, German inflation slowed down by 1.4% in December but this report was released just after the euro plummeted. Nevertheless, we can presume that the market got some insider information about German inflation and that caused a sharp sell-off of the euro because the market thinks that the European inflation will also collapse, which might make the European Central Bank even slower to tighten the monetary policy. I have been saying for a long time that the euro should fall. Perhaps now that process has begun.
EUR/USD on M5 chart
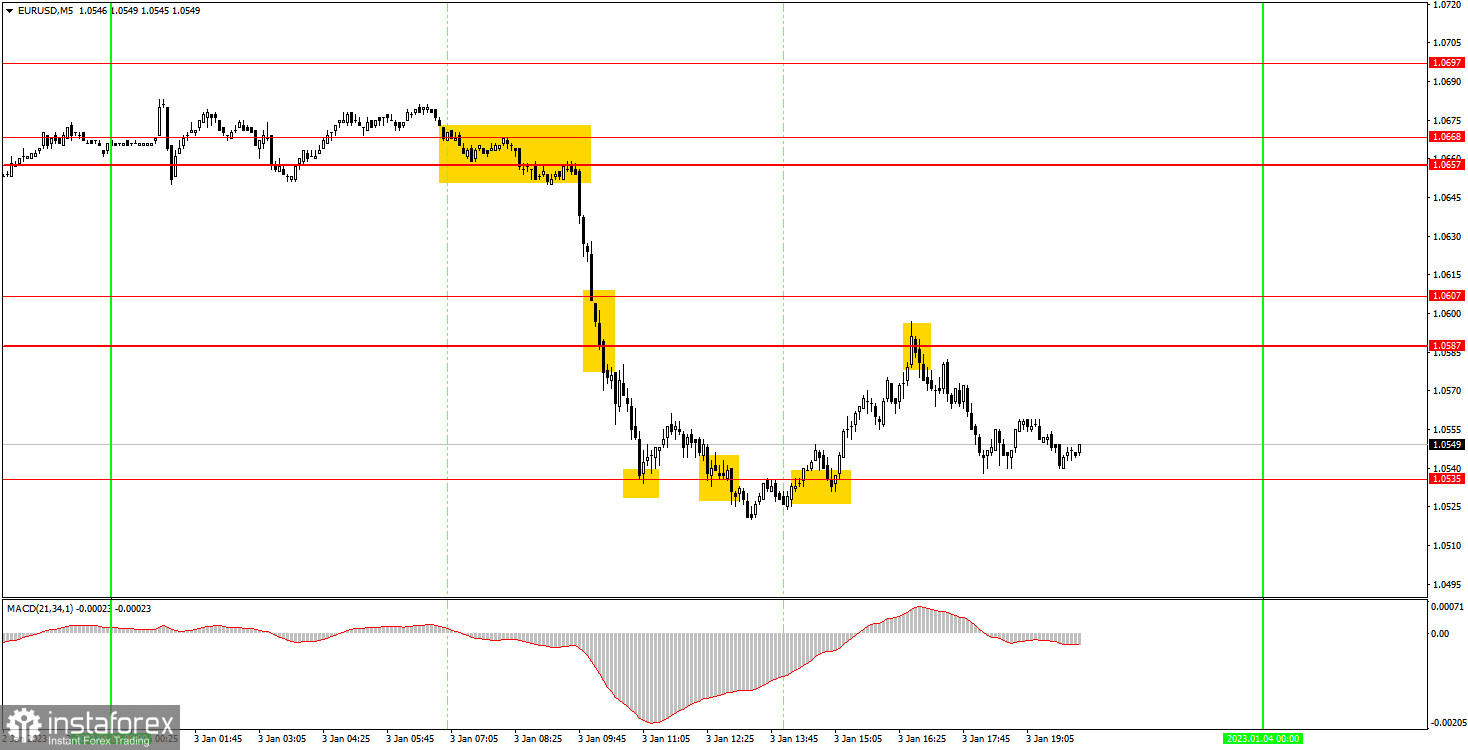
On Tuesday, trading signals were abundant and most of them were profitable. In the very beginning of the European session, there was a sell signal near the area of 1.0657-1.0668, after which the pair fell to 1.0535. Thus, beginners could earn about 90 pips on the first deal. The rebound from 1.0535 followed, which should have been worked out using a long position, but the signal turned out to be false. As well as the following signal near 1.0535 for short positions. You could not avoid losses on these two transactions, which amounted to about 25 pips (the first trade was closed at Stop Loss). And here the third signal near 1.0535 should be ignored because the first two signals turned out to be false. Instead, it was possible to work out the rebound from 1.0587, which made it possible to earn about 25 pips more. Therefore, you could end Tuesday with profit around 90 pips.
Trading tips on Wednesday:
On the 30-minute chart, EUR/USD sharply and unexpectedly ended the flat. Therefore, we can expect the euro to fall, just as I expected for several weeks now. Both technical and fundamental factors speak in favor of it. On the 5-minute chart on Wednesday, it is recommended to trade at the levels 1.0354, 1.0391, 1.0433, 1.0465-1.0483, 1.0536, 1.0587-1.0607, 1.0657-1.0668 and 1.0697. As soon as the price passes 15 pips in the right direction, you should set a Stop Loss to breakeven. On Wednesday, business activity indices will be published in the EU and the US. However, the US ISM index is much more important to the market than the European one. In fact, the ISM index is the only important report on Wednesday.
Basic rules of the trading system:
1) The strength of the signal is determined by the time it took the signal to form (a rebound or a breakout of the level). The quicker it is formed, the stronger the signal is.
2) If two or more positions were opened near a certain level based on a false signal (which did not trigger a Take Profit or test the nearest target level), then all subsequent signals at this level should be ignored.
3) When trading flat, a pair can form multiple false signals or not form them at all. In any case, it is better to stop trading at the first sign of a flat movement.
4) Trades should be opened in the period between the start of the European session and the middle of the US trading hours when all positions must be closed manually.
5) You can trade using signals from the MACD indicator on the 30-minute time frame only amid strong volatility and a clear trend that should be confirmed by a trendline or a trend channel.
6) If two levels are located too close to each other (from 5 to 15 pips), they should be considered support and resistance levels.
On the chart:
Support and Resistance levels are the levels that serve as targets when buying or selling the pair. You can place Take Profit near these levels.
Red lines are channels or trend lines that display the current trend and show in which direction it is better to trade now.
The MACD indicator (14, 22, and 3) consists of a histogram and a signal line. When they cross, this is a signal to enter the market. It is recommended to use this indicator in combination with trend patterns (channels and trendlines).
Important announcements and economic reports that can be found on the economic calendar can seriously influence the trajectory of a currency pair. Therefore, at the time of their release, we recommend trading as carefully as possible or exiting the market in order to avoid sharp price fluctuations.
Beginners on Forex should remember that not every single trade has to be profitable. The development of a clear strategy and money management is the key to success in trading over a long period of time.


