


Analyzing Tuesday's trades:
GBP/USD on 30M chart
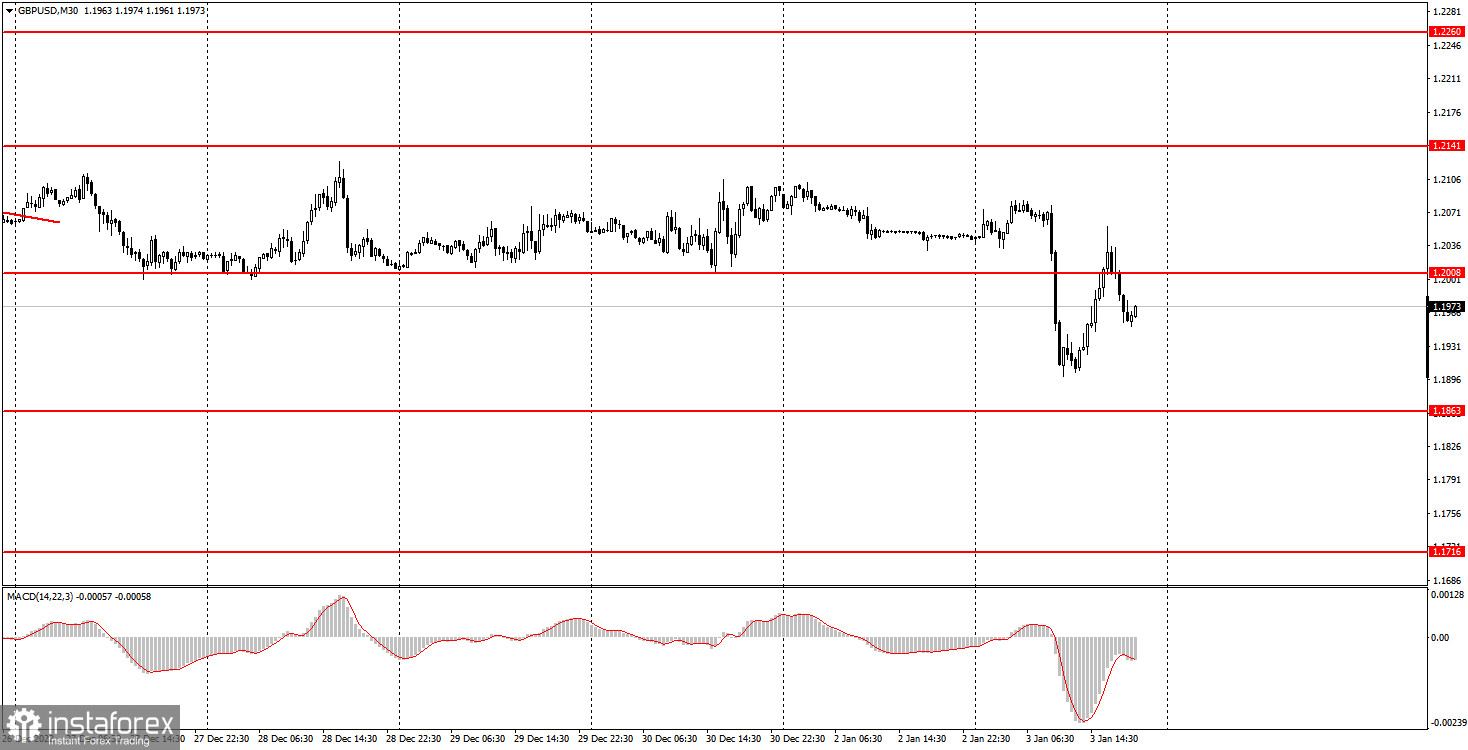
GBP/USD also sharply ended the flat on Tuesday and showed a "roller coaster ride". In the course of the day, the pound managed to go down and almost completely recover all its losses, and then resumed its fall. So, assumptions that the euro's fall could have been triggered by a good German inflation report are most likely unfounded. The market simply got tired of celebrating and at a certain point resumed its usual trading mode. The pair has left the horizontal channel of 1.2008-1.2141, so now we can expect a trend. I believe that the pound will continue to fall. It has no growth factors for now. Of course, we should take into account the "Friday factor", when the Nonfarm and the unemployment data will be published. The market hardly knows what these reports will be, but theoretically such an option is possible too.
GBP/USD on M5 chart
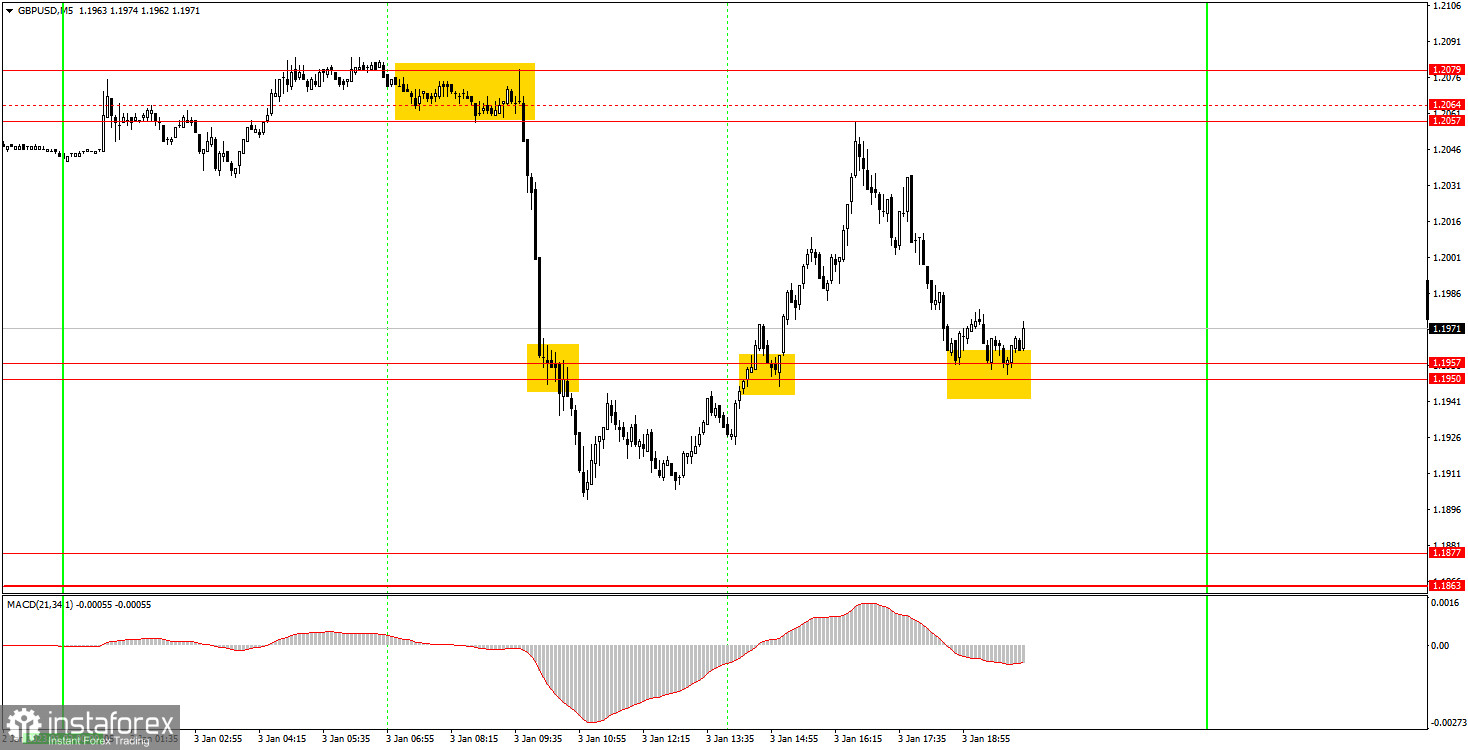
Trading signals on the 5-minute chart were very good. There was a strong sell signal at 1.2064-1.2079 at the very beginning of the European session. After that the pair fell by 150 pips, crossing 1.1950-1.1957. However, traders couldn't gain the most amount of profit because the price reversed upward and crossed 1.1950-1.1957. At this point, short positions should have been closed. Profit was around 80 points. The buy signal around 1.1950-1.1957 was also worth working out, but the price was unlucky, because it missed the target level of 1.2057 by just a few pips. Therefore, it would've been great if novice traders managed to close the deal manually. If not, there wouldn't have been a loss anyway since the pair went up more than 20 pips, which means that a Stop Loss should have been set to breakeven. Thus, traders could've ended the day in profit anyway.
Trading tips on Wednesday:
On the 30-minute chart, GBP resumed the downtrend. Since the flat ended, we can now expect the British pound to continue falling. The situation may change on Friday since important macro data will be released in America, which may strongly influence the market mood. But I still expect the pound to continue falling. On the 5-minute chart, it is recommended to trade at the levels 1.1793, 1.1863-1.1877, 1.1950-1.1957, 1.2008, 1.2057-1.2079, 1.2141, 1.2186-1.2205. As soon as the price passes 20 pips in the right direction, you should set a Stop Loss to breakeven. There is nothing interesting planned for Wednesday in Great Britain. On the other hand, the ISM report for the manufacturing sector will be released in the US, which we consider as the most important report of the day. The minutes of the last Federal Reserve meeting will be announced late in the evening, by which time intraday traders should be out of the market.
Basic rules of the trading system:
1) The strength of the signal is determined by the time it took the signal to form (a rebound or a breakout of the level). The quicker it is formed, the stronger the signal is.
2) If two or more positions were opened near a certain level based on a false signal (which did not trigger a Take Profit or test the nearest target level), then all subsequent signals at this level should be ignored.
3) When trading flat, a pair can form multiple false signals or not form them at all. In any case, it is better to stop trading at the first sign of a flat movement.
4) Trades should be opened in the period between the start of the European session and the middle of the US trading hours when all positions must be closed manually.
5) You can trade using signals from the MACD indicator on the 30-minute time frame only amid strong volatility and a clear trend that should be confirmed by a trendline or a trend channel.
6) If two levels are located too close to each other (from 5 to 15 pips), they should be considered support and resistance levels.
On the chart:
Support and Resistance levels are the levels that serve as targets when buying or selling the pair. You can place Take Profit near these levels.
Red lines are channels or trend lines that display the current trend and show in which direction it is better to trade now.
The MACD indicator (14, 22, and 3) consists of a histogram and a signal line. When they cross, this is a signal to enter the market. It is recommended to use this indicator in combination with trend patterns (channels and trendlines).
Important announcements and economic reports that can be found on the economic calendar can seriously influence the trajectory of a currency pair. Therefore, at the time of their release, we recommend trading as carefully as possible or exiting the market in order to avoid sharp price fluctuations.
Beginners on Forex should remember that not every single trade has to be profitable. The development of a clear strategy and money management is the key to success in trading over a long period of time.


