


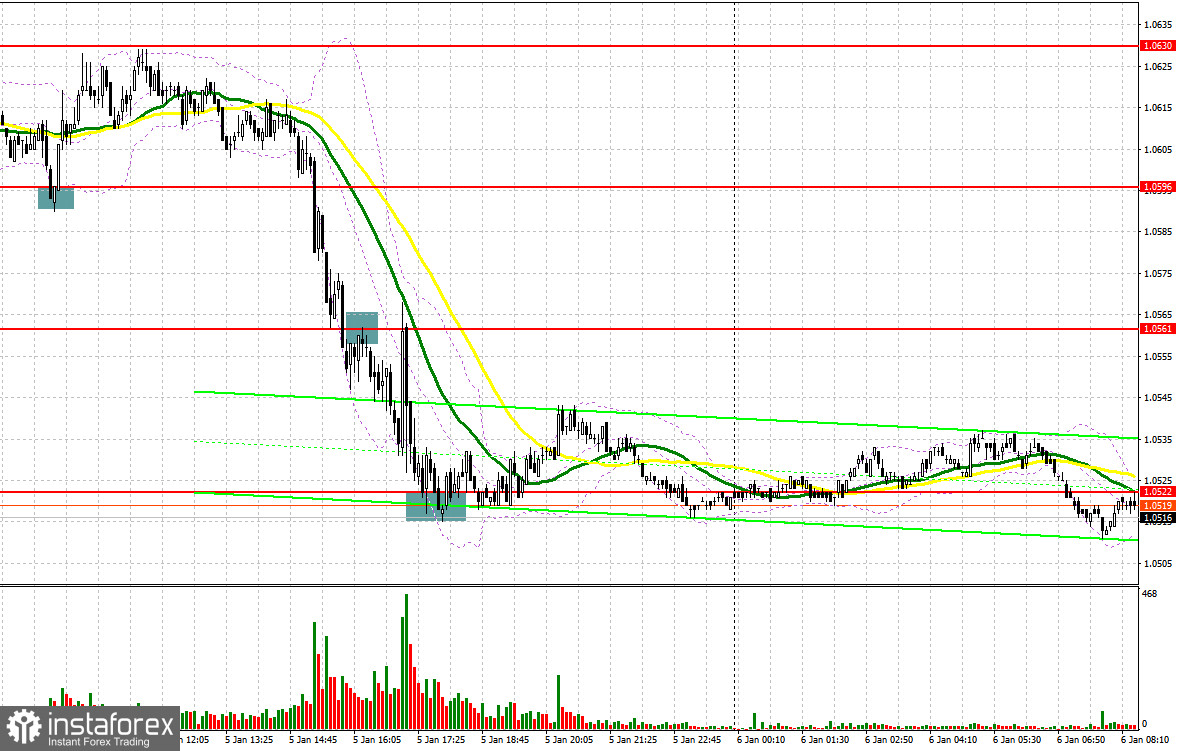
Yesterday, there were great signals to enter the market. Let's take a look at the 5-minute chart and figure out what happened. Earlier, I asked you to pay attention to 1.0596 to decide when to enter the market. As a result of the decline, a false breakout around 1.0596 gave an excellent buy signal. As a result, the pair rose by more than 30 pips, but failed to test 1.0630. In the afternoon, after the strong ADP employment report, a breakout and a retest to 1.0561 resulted in a sell signal to test the low at 1.0522, which took about 40 pips more from the market. There was no sharp bounce from 1.0522.
When to open long positions on EUR/USD:
The strong US labor market suggests that the Federal Reserve will continue to pursue a tight policy and raise interest rates despite the decline in inflation toward the end of 2022. This is one of the main reasons why the dollar grew, which will occur in the first half of the year. But it's all about determining the general trend, which is obvious as it is. During the European session, I advise you to pay attention to the results on the change in retail sales and the change in factory orders in Germany. However, the consumer price index in the euro area for December this year is a much more important indicator. A decline in inflation will significantly weigh on the euro. For this reason, it is better to buy the pair on a decline around 1.0493. A false breakout at this level will produce a signal to enter the market, allowing the bulls to hit the Asian session's high at 1.0535. A breakout and test of that level will be another entry point to go long, to test the high at 1.0566. This is where the bearish MAs are located. A breakout through the level will trigger stop orders and generate another buy signal, targeting 1.0596. If the pair tests this level it will cross out the new bearish trend. This is where it is wiser to lock in profits. Should EUR/USD go down when there is no bullish activity at 1.0493, the pressure on the pair will remain, so the emphasis will be placed on the US data, which will be discussed in the afternoon. A false breakout at the next support at 1.0451 is another buy signal. It will become possible to buy EUR/USD on a rebound from the low at 1.0395 or even lower around 1.0346, allowing a bullish correction of 30 to 35 pips intraday.
When to open short positions on EUR/USD:
The bears regained control of the market yesterday and are now counting on strong US data. But before that, they have to try hard not to release the euro above 1.0535. In case the pair rises during the European session, due to a strong eurozone inflation in December 2022, the best scenario to sell is when the pair does not settle above 1.0535, which will lead to a sell signal and a downward movement to 1.0493. A breakout and test of this range will increase the pressure on the euro, which is another sell signal towards 1.0451, where the bears are likely to loosen their grip on the market. The pair will fall to 1.0395 if it consolidates below this mark. That would also bring back hopes of a bearish market for the euro at the beginning of the year. The most distant target is seen at 1.0346 where it is wiser to lock in profits. If EUR/USD goes up during the European session when there is no bearish activity at 1.0535, I recommend to postpone shorts to 1.0566. It would be best to only sell there once the pair does not consolidate. Also, it will be possible to sell EUR/USD on a rebound from the high of 1.0596, allowing a bearish correction of 30 to 35 pips.
COT report:
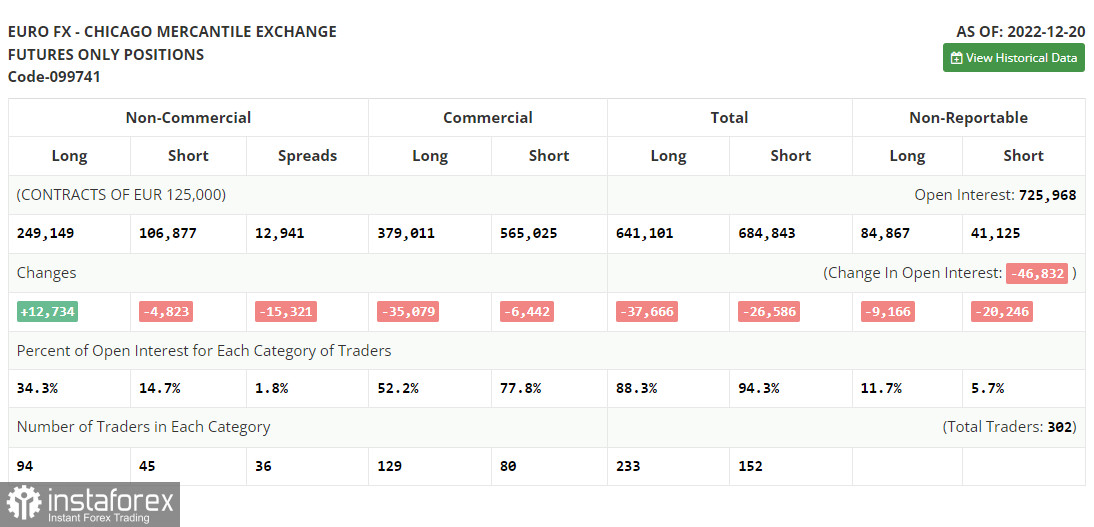
The COT report for December 20 revealed an increase in long positions and a drop in short ones. Traders preferred to increase longs on the euro after the central banks' meetings by the end of the year, and also amid good data on the eurozone and Germany, which were released last week. However it didn't affect the balance of forces to a great extent and we continue trading within the channel formed last week. Strong data on U.S. GDP growth in Q3 this year and the labor market are also keeping the U.S. dollar in demand, as traders expect further monetary tightening due to risks of continued high inflationary pressures next year. Add to all this a recession and you are unlikely to have much appetite for buying risky assets. According to the COT report, long non-commercial positions were up 12,734 to 249,149, while short non-commercials positions were down 4,823 to 106,877, and the total non-profit net positioning was up sharply to 142,279 versus 122,247. This indicates that investors, despite all fears, continue to buy euros in hopes of a sharper rate hike by the European Central Bank next year. But a new fundamental reason is needed in order for the euro to rise further. The weekly closing price rose to 1.0690 versus 1.0342.
Indicators' signals:
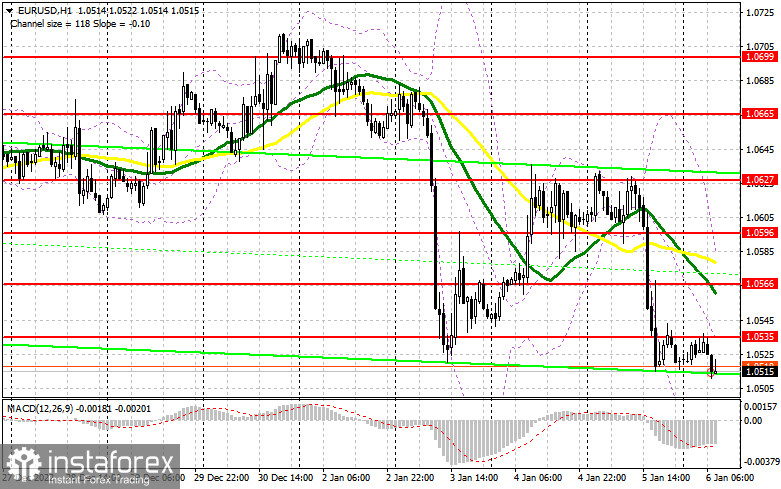
Trading is carried out below the 30 and 50 moving averages. It indicates that the bears are trying to build a new trend.
Moving averages
Note: The period and prices of moving averages are considered by the author on the H1 (1-hour) chart and differ from the general definition of the classic daily moving averages on the daily D1 chart.
Bollinger Bands
If EUR/USD rises, the indicator's upper limit at 1.0566 will serve as resistance. If it falls, the indicator's lower limit around 1.0493 will act as support.
Description of indicators
- Moving average (moving average, determines the current trend by smoothing out volatility and noise). Period 50. It is marked yellow on the chart.
- Moving average (moving average, determines the current trend by smoothing out volatility and noise). Period 30. It is marked green on the chart.
- MACD indicator (Moving Average Convergence/Divergence - convergence/divergence of moving averages) Quick EMA period 12. Slow EMA period to 26. SMA period 9
- Bollinger Bands (Bollinger Bands). Period 20
- Non-commercial speculative traders, such as individual traders, hedge funds, and large institutions that use the futures market for speculative purposes and meet certain requirements.
- Long non-commercial positions represent the total long open position of non-commercial traders.
- Short non-commercial positions represent the total short open position of non-commercial traders.
- Total non-commercial net position is the difference between the short and long positions of non-commercial traders.


