


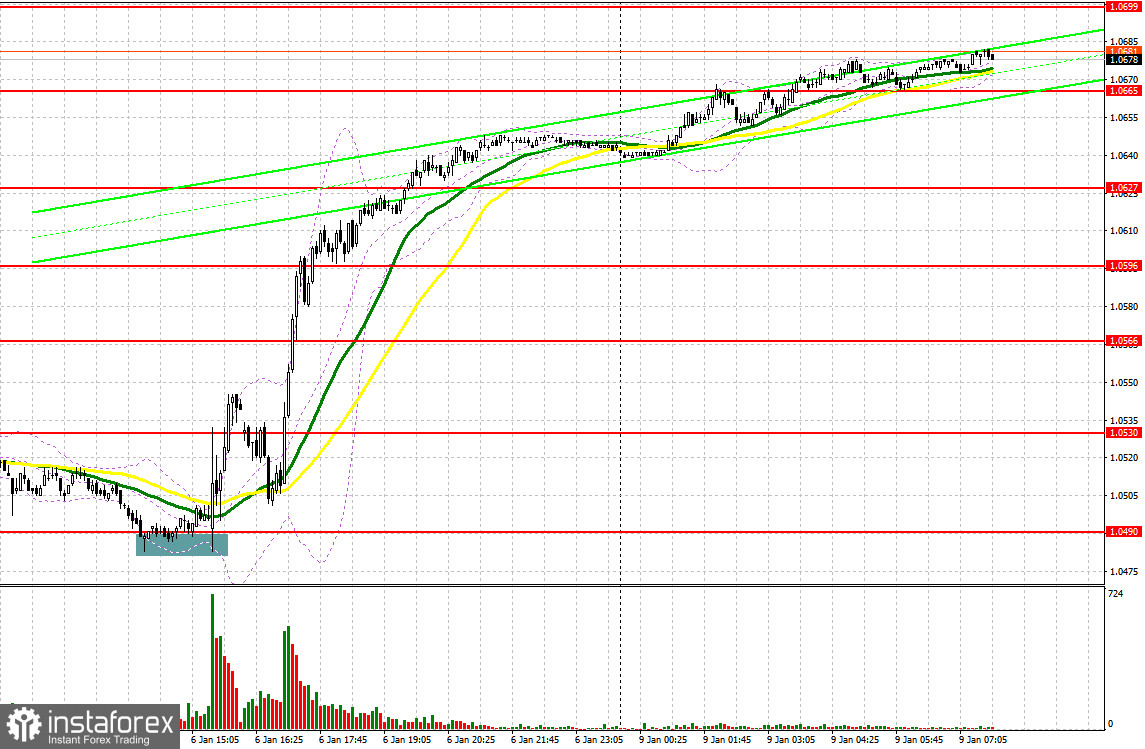
Last Friday, there was an excellent entry point. Let's look at the 5-minute chart and figure out what actually happened. In the morning article, I turned your attention to the levels of 1.0535 and 1.0493 and recommended making decisions with these levels in focus. The euro/dollar pair failed to reach the target levels despite the release of a bath of reports for the eurozone in the first half of the day. Hence, there were no entry points. In the afternoon, the bulls managed to protect the support level of 1.0490. It gave a buy signal. After weak US PMI Services data, the euro rose sharply by more than 170 pips.
When to open long positions on EUR/USD:
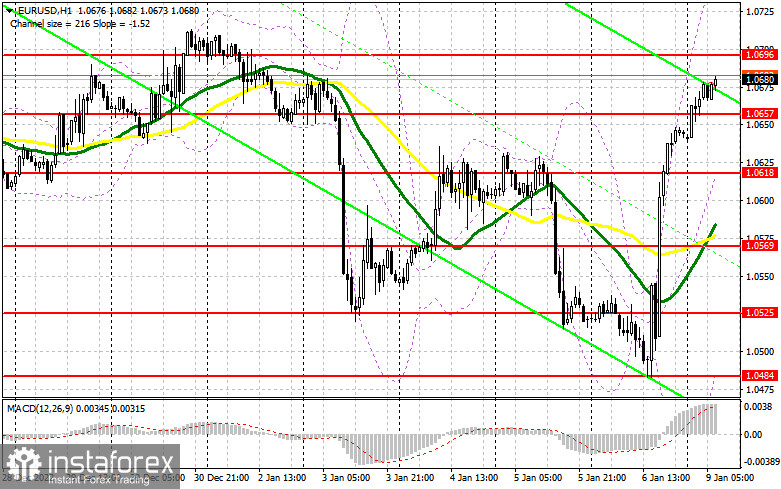
The US dollar held firmly at its levels thanks to a strong NFP report. However, the sentiment turned sour due to a drop in the PMI Indices. It signaled once again the possibility of a recession this year. Besides, high interest rates make this scenario rather feasible. It appears there might be more devastating consequences from the Fed's monetary tightening. However, the central bank has repeated many times it is ready to sacrifice an economic expansion to tame inflation. Interest rates are likely to remain high in the long term, which could limit demand for risky assets. Today, there will hardly be reports that may undermine Friday's rally. This is why the pair is expected to grow higher in the European session. German industrial production data for November and the unemployment rate of the eurozone are of little importance. The best scenario for opening long positions would be a decline and a false breakout of the support level of 1.0657. In this case, the pair may reach the resistance level of 1.0696. A breakout and a downward retest of this level will generate an additional entry point in long positions with a jump to a high of 1.0733. A breakout of this level will force bears to close Stop Loss orders and give an additional buy signal with the possibility of a rise to a new yearly high of 1.0772. A test of this level will undermine the bearish trend. I recommend locking in profits there. If EUR/USD declines and bulls show no activity at 1.0657, the pressure on the pair will increase slightly. However, the bulls will hardly lose the upper hand. In this case, only a false breakout of the support level of 1.0618 will provide a new buying opportunity. You could open long positions at a bounce from the low of 1.0569, where the moving averages are benefiting the bulls, or lower at 1.0525, keeping in mind an upward intraday correction of 30-35 pips.
When to open short positions on EUR/USD:
Bears lost momentum following Friday's economic data. Nevertheless, Friday's upward movement may end as quickly as it began. This is why sellers are likely to make an attempt to protect the resistance level of 1.0696. If the pair grows during the European session amid strong data, it is better to open short positions after a failure to consolidate above 1.0696. It could create a sell signal with the prospect of a drop to 1.0657. A breakout and an upward test of this level could considerably weaken the short-term bullish momentum, escalating pressure on the euro. It could also give an additional sell signal with a decline to 1.0618. At this level, the bears will hardly be able to remain in control. A decrease below this level will lead to a more significant downward movement to 1.0569. The bears will again regain the upper hand. A more distant target will be the 1.0525 level where I recommend locking in profits. If EUR/USD rises during the European session and bears show no energy at 1.0696, I would advise you to postpone short positions until a false breakout of 1.0733. You could also sell EUR/USD at a bounce from a high of 1.0772, keeping in mind a downward intraday correction of 30-35 pips.
COT report
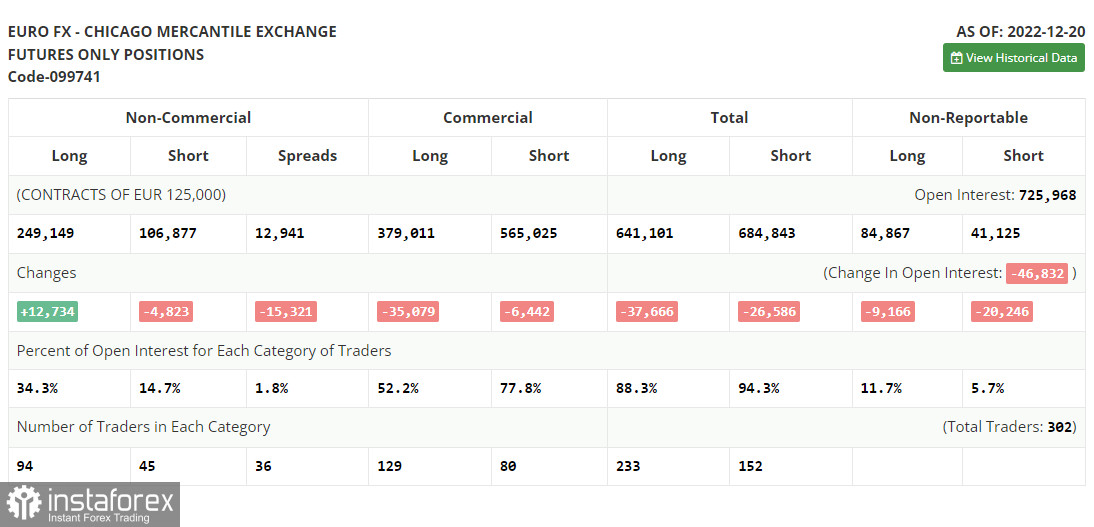
The COT report (Commitment of Traders) for December 20 logged a rise in long positions and a drop in short ones. Traders increased long positions on the euro after the meetings of central banks at the end of last year as well as amid upbeat statistics on the eurozone and Germany published last week. However, these factors did not affect significantly the sentiment. So, the pair is still stuck within the channel formed last week. Strong data on US GDP for the 3rd quarter and the labor market stimulated demand for the US dollar. Traders expect further tightening of monetary policy due to the risks of inflationary pressure this year. What is more, risky assets are unable to resume an upward movement due to recession fears. The COT report revealed that long non-commercial positions advanced by 12,734 to 249,149, while short non-commercial positions fell by 4,823 to 106,877. At the end of the week, the total non-commercial net position increased sharply and amounted to 142,279 against 122,247. It indicates that investors continue to buy the euro despite the risks, betting on a sharper rate hike by the ECB. However, the euro needs new drivers for further growth. The weekly closing price jumped to 1.0690 against 1.0342.
Indicators' signals:
Trading is carried out above the 30 and 50 daily moving averages. It indicates a trend reversal.
Moving averages
Note: The period and prices of moving averages are considered by the author on the H1 (1-hour) chart and differ from the general definition of the classic daily moving averages on the daily D1 chart.
Bollinger Bands
If EUR/USD climbs, the indicator's upper border at 1.0750 will serve as resistance. In case of a decline, the indicator's lower border at 1.0500 will act as support.
Description of indicators
- Moving average (moving average, determines the current trend by smoothing out volatility and noise). Period 50. It is marked yellow on the chart.
- Moving average (moving average, determines the current trend by smoothing out volatility and noise). Period 30. It is marked green on the chart.
- MACD indicator (Moving Average Convergence/Divergence - convergence/divergence of moving averages) Quick EMA period 12. Slow EMA period to 26. SMA period 9
- Bollinger Bands (Bollinger Bands). Period 20
- Non-commercial speculative traders, such as individual traders, hedge funds, and large institutions that use the futures market for speculative purposes and meet certain requirements.
- Long non-commercial positions represent the total long open position of non-commercial traders.
- Short non-commercial positions represent the total short open position of non-commercial traders.
- Total non-commercial net position is the difference between the short and long positions of non-commercial traders.


