


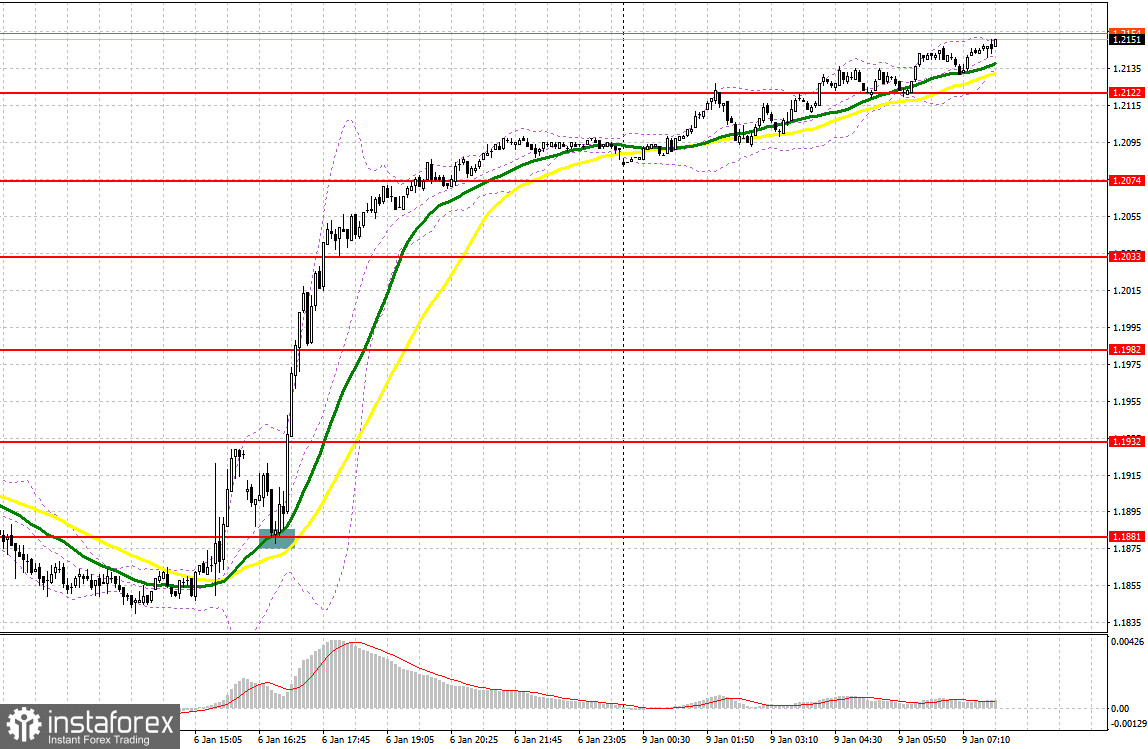
A few entry signals were made on Friday. Let's take a look at the M5 chart to get a picture of what happened. In the previous review, we focused on the mark of 1.1881 and considered entering the market there. A fall and a false breakout through the level ruined the plans of the bulls to extend the uptrend, and the pair went down below 1.1881. In the course of the North American session, a sell signal was produced after a breakout and a retest at 1.1881. Eventually, the price advanced by more than 200 pips.
When to go long on GBP/USD:
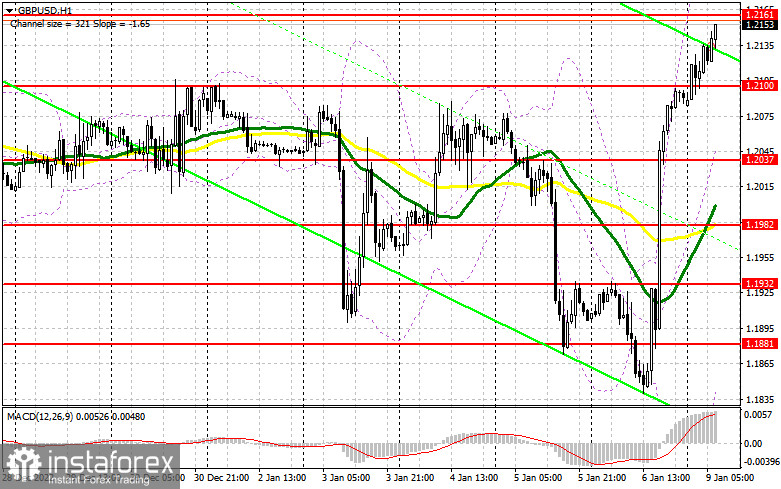
GBP/USD ignored data on the UK's construction PMI and reacted with a surge to the disappointing ISM services PMI report in the US on Friday. Today, the GBP bulls are likely to remain on a buying spree. Still, it is important to be careful with buying the pair at the current highs as pessimistic results in the US are now not necessarily good for risk assets. Rather, it indicates a looming recession in the country as well as the rest of the world. Therefore, it is wiser to buy the pair when the price goes down. Moreover, no macro reports are set to be released in the UK today. A false breakout through 1.2100 will make a buy signal and pave the way to a continuation of the uptrend, the formation of the lower limit of the new ascending channel, and a breakout through resistance at 1.2161. If the price consolidates within this range, which is possible due to disappointing Friday results, we may then expect a surge to 1.2219. In case of a breakout and a test of this level, the target stands at 1.2260 where it will become possible to lock in profit. If the bulls lose grip of 1.2100, GBP/USD will come under strong pressure. That will trigger an insignificant bearish correction as well as the row of bullish stop orders, placed below. Therefore, it is wiser to go long only after a false breakout through the low of 1.2037. It will also become possible to buy GBP/USD on a rebound from 1.1982, allowing a correction of 30 to 35 pips intraday.
When to go short on GBP/USD:
The bears are unlikely to trade aggressively today. Still, they should already consider how to protect the level of 1.2161. If they manage to prevent the pair from going above the mark, there may appear those willing to sell the pair counting on a modest correction at the beginning of the week, following an unexpected and steep rise on Friday. As long as the pair is trading below 1.2161, the sellers have every chance for a bearish correction. A false breakout through 1.2161 will generate a sell signal with the target at 1.2100. A breakout and a retest of this mark to the upside will create a sell entry point with the target at 1.2037, which will be seen as a deeper correction. It will also become possible to lock in profit there. In case of growth in GBP/USD and the absence of the bears at 1.2161, the bulls will tighten their grip on the market. A sell entry point will form after a false breakout through 1.2219 only, and a continuation of the downtrend will follow. If there is no trading activity there, GBP/USD could be sold on a rebound from the high of 1.2260, allowing a bearish correction of 30 to 35 pips intraday.
Commitments of Traders:
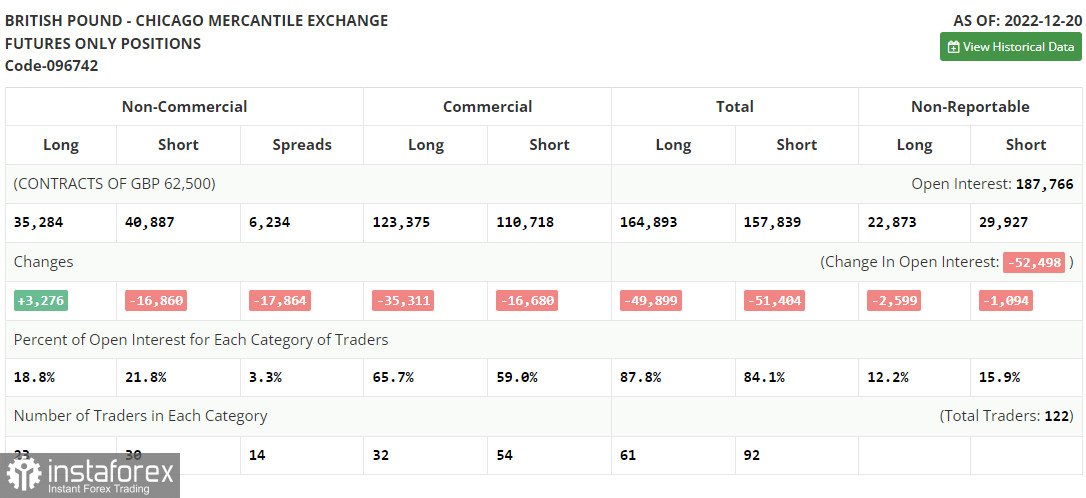
The COT report for December 20 logged a rise in long positions and a fall in short positions. Following the meetings of the largest central banks, including the Bank of England, it became clear that the tightening cycle would continue, which should boost demand for national currencies, including the pound sterling. This is exactly what the COT report shows. However, given that the UK's Q3 GDP was downwardly revised and that the country is now facing a recession, traders may be less interested in the pound in January. According to the latest COT report, short non-commercial positions dropped by 16,860 to 40,887 and long non-commercial positions grew by 3,276 to 35,284. Consequently, the non-commercial net position came in at -5,603 versus -25,739 a week ago. The weekly closing price of GBP/USD decreased to 1.2177 versus 1.2377.
Indicator signals:
Moving averages
Trading is carried out above the 30-day and 50-day moving averages, reflecting the possibility of a reversal.
Note: The period and prices of moving averages are viewed by the author on the hourly chart and differ from the general definition of classic daily moving averages on the daily chart.
Bollinger Bands
Resistance stands at 1.2250, in line with the upper band.
Indicator description:
- Moving average (MA) determines the current trend by smoothing volatility and noise. Period 50. Colored yellow on the chart.
- Moving average (MA) determines the current trend by smoothing volatility and noise. Period 30. Colored green on the chart.
- Moving Average Convergence/Divergence (MACD). Fast EMA 12. Slow EMA 26. SMA 9.
- Bollinger Bands. Period 20
- Non-commercial traders are speculators such as individual traders, hedge funds, and large institutions who use the futures market for speculative purposes and meet certain requirements.
- Long non-commercial positions are the total long position of non-commercial traders.
- Non-commercial short positions are the total short position of non-commercial traders.
- Total non-commercial net position is the difference between the short and long positions of non-commercial traders.


