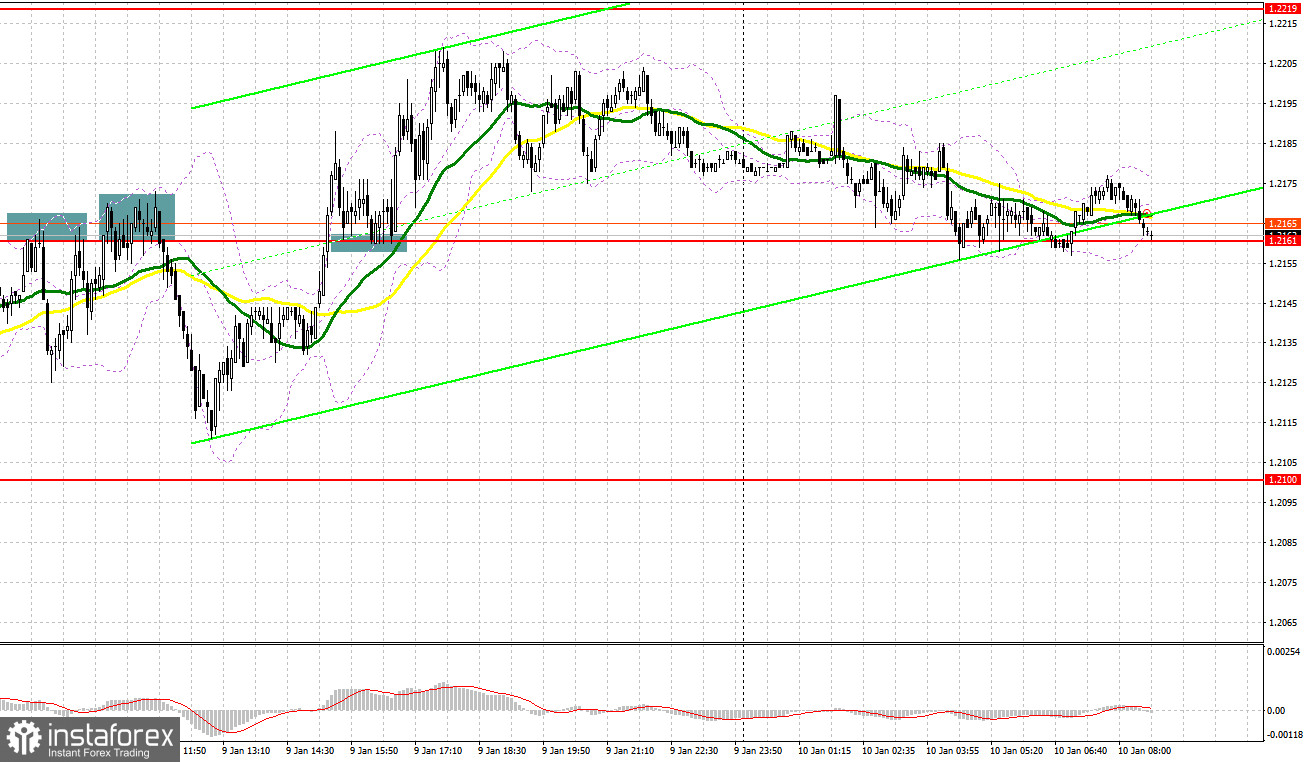
A few entry signals were generated yesterday. Let's take a look at the M5 chart to get a picture of what happened. In the previous review, we focused on the mark of 1.2161 and considered entering the market there. Growth and a false breakout through the level in the course of the European session made a sell signal. The pair plunged by over 45 pips. During the North American session, a breakout and a retest of the 1.2161 mark to the downside produced a buy signal. As a result, the quote swelled by 50 pips but failed to reach resistance at 1.2219.

When to go long on GBP/USD:
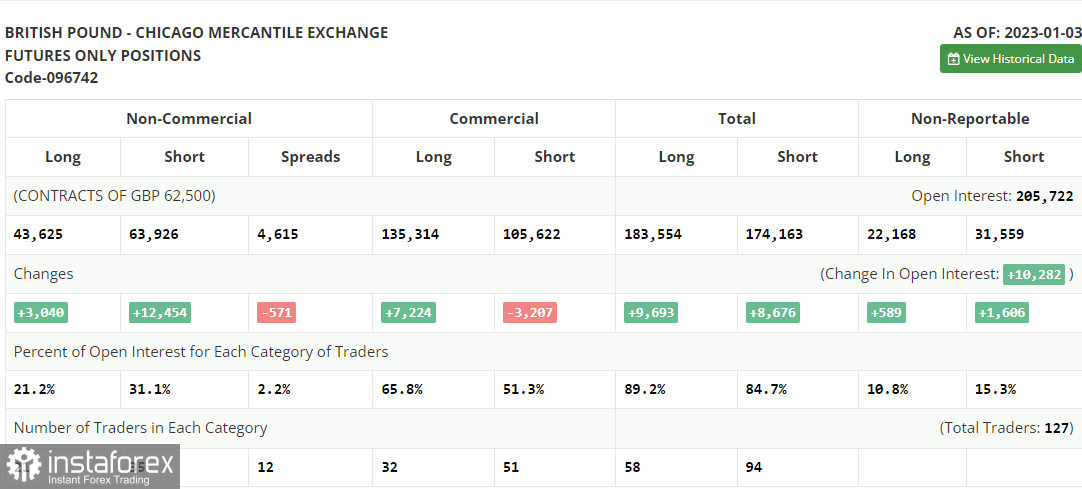
Before we look at the chart, let's turn to the futures market. The COT report for January 3 logged a rise in long and short positions with the number of longs exceeding the number of shorts almost four times. This shows that the bulls have little faith in a stronger pound at the beginning of the year. The fact that world regulators are determined to continue the tightening cycle bodes no well for the pound. The UK is already in a recession. The Bank of England is planning to cut interest rates, which is another restraining factor for the currency. If US inflation accelerates again, we will hardly see a stronger sterling in the first quarter of the year. According to the latest COT report, short non-commercial positions increased by 12,454 to 43,625 and long non-commercial positions grew by 3,040 to 43,625. Consequently, the non-commercial net position came in at -20,301 from -5,603 a week ago, which reflects the bulls' unwillingness to buy the pair at the current highs. The weekly closing price of GBP/USD decreased to 1.2004 versus 1.2177.

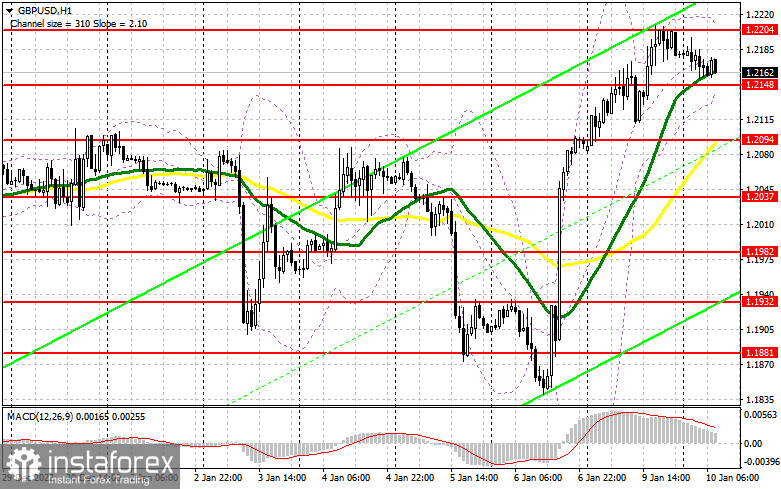
A calm trading day is expected in the market today. The bears may take control of the market as all technical indicators are now moving up in the overbought zone. If the bears manage to break through support at 1.2148, a sell-off may start. Therefore, long positions could be considered after a false breakout through 1.2148. That will reveal the presence of traders willing to buy the pair at the beginning of the year. The pair will get to the high of 1.2204. Without this level, the bulls should not count on a correction. The uptrend may extend if the pair goes further up. Meanwhile, a breakout through 1.2204 along with a downside retest may result in growth to 1.2260 where it is wiser to lock in profit. The most distant target stands at 1.2301. If GBP/USD goes down and there is a lack of bullish activity at 1.2148, the balance of trading forces in the market will be lost, and the bears will push the pair further down. In such a case, long positions could be opened after a false breakout through 1.2094. It will also become possible to buy GBP/USD on a rebound from 1.2037, allowing a correction of 30 to 35 pips intraday.
When to go short on GBP/USD:
The bears are trying to take control of the market ahead of Fed Chair Powell's speech today, who is likely to talk about the regulator's future monetary policy plans. So, they should push the pair below 1.2148, which may take place in the course of the North American session. But before that, they should protect the mark of 1.2204, new resistance. This will allow the bears to tighten their grip on the market. Should GBP/USD go up, a false breakout through 1.2148 will generate a sell signal, and the target will stand at the support level of 1.2148. A breakout and a retest of this mark to the upside will create a sell entry point with the target at the low of 1.2094, which is in line with bullish moving averages. A more distant target is seen at 1.2037 where it is wiser to lock in profits. In case of growth in GBP/USD and the absence of the bears at 1.2204, a new bullish trend will start, and GBP/USD will rise to 1.2260. A sell entry point will form after a false breakout through the mark, and a downward reversal may follow. If there is no trading activity there, GBP/USD could soar to 1.2301 where the pair could be sold on a rebound, allowing a bearish correction of 30 to 35 pips intraday.

Indicator signals:
Moving averages
Trading is carried out slightly above the 30-day and 50-day moving averages, indicating an uptrend.
Note: The period and prices of moving averages are viewed by the author on the hourly chart and differ from the general definition of classic daily moving averages on the daily chart.
Bollinger Bands
Bullish continuation is likely in case of a breakout through the upper band at 1.2204. Pressure on the pair could increase, should the price break through the lower band at 1.2145.
Indicator description:
- Moving average (MA) determines the current trend by smoothing volatility and noise. Period 50. Colored yellow on the chart.
- Moving average (MA) determines the current trend by smoothing volatility and noise. Period 30. Colored green on the chart.
- Moving Average Convergence/Divergence (MACD). Fast EMA 12. Slow EMA 26. SMA 9.
- Bollinger Bands. Period 20
- Non-commercial traders are speculators such as individual traders, hedge funds, and large institutions who use the futures market for speculative purposes and meet certain requirements.
- Long non-commercial positions are the total long position of non-commercial traders.
- Non-commercial short positions are the total short position of non-commercial traders.
- Total non-commercial net position is the difference between the short and long positions of non-commercial traders.


