


You require the following to open long positions on EUR/USD:
Unfortunately, there are no significant statistics for the US session even today, and currency traders are unlikely to be interested in the anticipated report on crude oil reserves and the auction for the placement of 10-year treasury notes. In light of this, I anticipate either a decrease in the euro or a continuation of trading within the side channel, where we have been for the past two days. By analogy with yesterday, a downturn and the development of a false breakdown in the 1.0722 support area will suggest a time to enter the market, allowing the bulls to reach the week's high in the region of 1.0758, above which it was unable to exit in the morning. With an increase at 1.0791, the emergence of a new bullish trend will be signaled by a breakout and top-down test of this range, which will create another entry point for building up long holdings. Only in the event of full inactivity on the part of sellers (who will hit their stop orders and create a second signal) will this level break, possibly leading to a breakthrough to 1.0820, where I will fix profits. The pressure on the pair will rise dramatically if the EUR/USD declines and there are no buyers above 1.0722 in the afternoon, which is most likely to happen. Therefore, the focus will be on the next level of support at 1.0687, where the development of a false collapse will be the only indicator that it is time to buy the euro. For a rebound from the low of 1.0653, or even lower - around 1.0618 - I will begin long positions right away with the goal of an upward correction of 30-35 points during the day.
You need the following to open short positions on EUR/USD:
Due to a paucity of information, traders are waiting it out ahead of tomorrow's US inflation report, which has the potential to drastically change the market. Few people are willing to take chances as a result. Sellers must maintain their position below 1.0758, and the likelihood of a greater correction will persist as long as trading is done below this level. If the EUR/USD rises already during the American session, the best scenario for selling would be a failed consolidation above 1.0758, similar to what I discussed above. This would signal the opening of short positions, which would move the price down to the area of 1.0722, which was tested several times during trading yesterday. It will be fascinating to see how this range holds up to a breakdown and reversal test, which may substantially impair short-term bullish prospects, put more pressure on the euro, and create a second sell signal with an exit to the 1.0687 level. A consolidation below this band will result in a stronger decline to the area of 1.0653, which will bring back the bear market. I'll set the profit there. Short trades from 1.0791 are preferable if the EUR/USD rises during the American session and there are no bears at 1.0758. Another smart move is to watch for a failed attachment there. As soon as the price of the EUR/USD recovers from its high of 1.0820, I will sell it, hoping for a 30- to 35-point drop to the downside.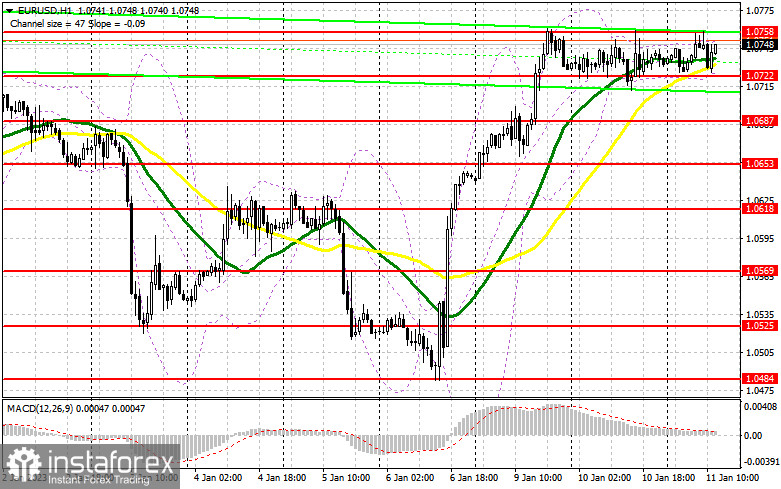
Signals from indicators
Moving Averages
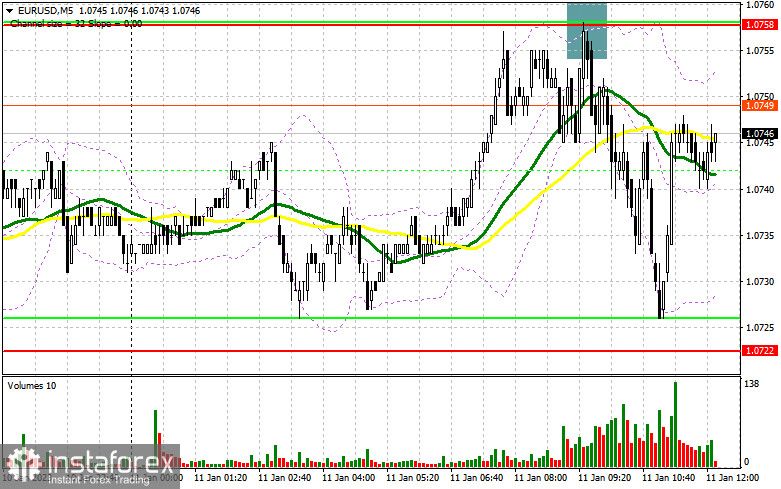
The fact that trading occurs around the 30 and 50-day moving averages suggests that the market is lateral.
Notably, the author considers the time and prices of moving averages on the hourly chart H1 and departs from the standard definition of the traditional daily moving averages on the daily chart D1.
Bands by Bollinger
The indicator's upper bound, which is at 1.0750, will serve as resistance in the event of an increase.
Description of indicators
- Moving average (moving average determines the current trend by smoothing out volatility and noise). Period 50. The graph is marked in yellow.
- Moving average (moving average determines the current trend by smoothing out volatility and noise). Period 30. The graph is marked in green.
- MACD indicator (Moving Average Convergence / Divergence - moving average convergence/divergence) Fast EMA period 12. Slow EMA period 26. SMA period 9
- Bollinger Bands (Bollinger Bands). Period 20
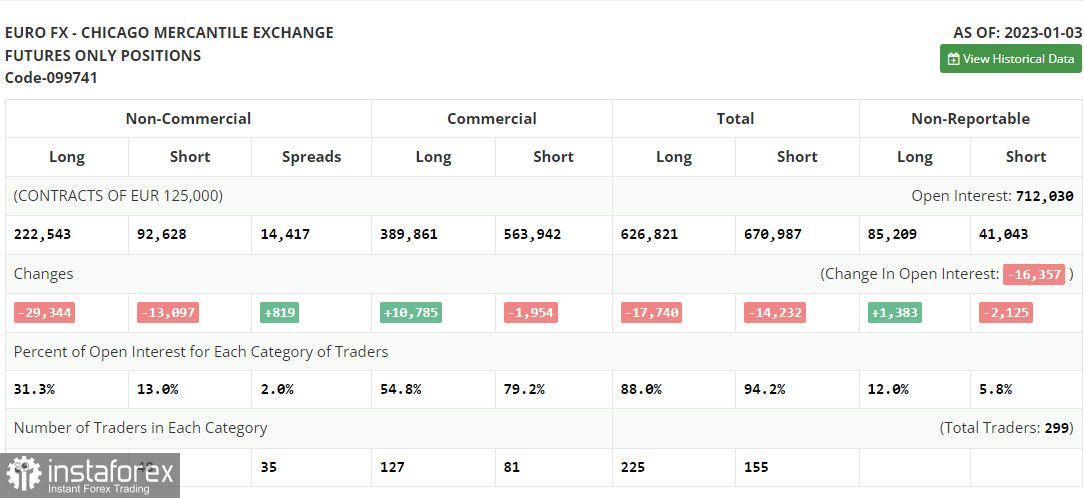
- Non-profit speculative traders, such as individual traders, hedge funds, and large institutions use the futures market for speculative purposes and to meet certain requirements.
- Long non-commercial positions represent the total long open position of non-commercial traders.
- Short non-commercial positions represent the total short open position of non-commercial traders.
- Total non-commercial net position is the difference between the short and long positions of non-commercial traders.


