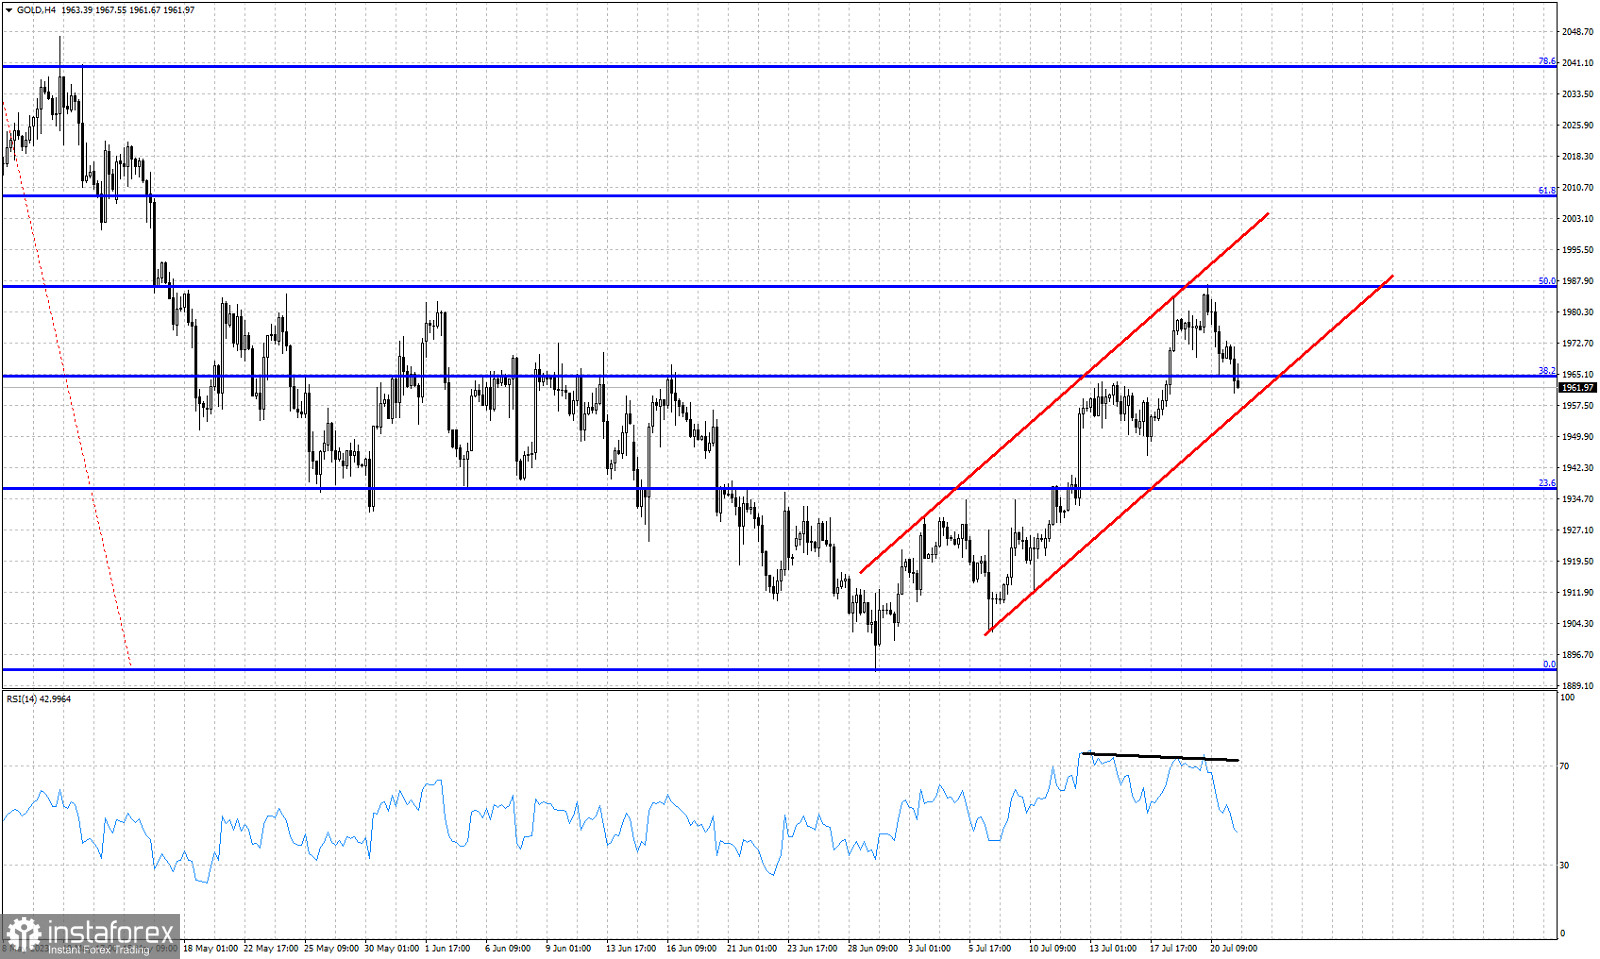
Black line- bearish RSI divergence
Red lines- bullish channel
Blue lines- Fibonacci retracement levels
Gold price is trading around $1,960 after making a high around $1,987 and getting rejected at the 50% Fibonacci retracement of the last leg down from $2,080. Price remains inside the red upward sloping channel and is now challenging the lower channel support. Gold price is under pressure. Support is found at the lower channel boundary at $1,955. So far price continues making higher highs and higher lows inside the red channel. An exit out of the channel and a break below $1,945 would be a bearish sign, implying more downside should be expected. For now our primary scenario is for Gold price to find support around the red lower channel boundary and turn higher.


