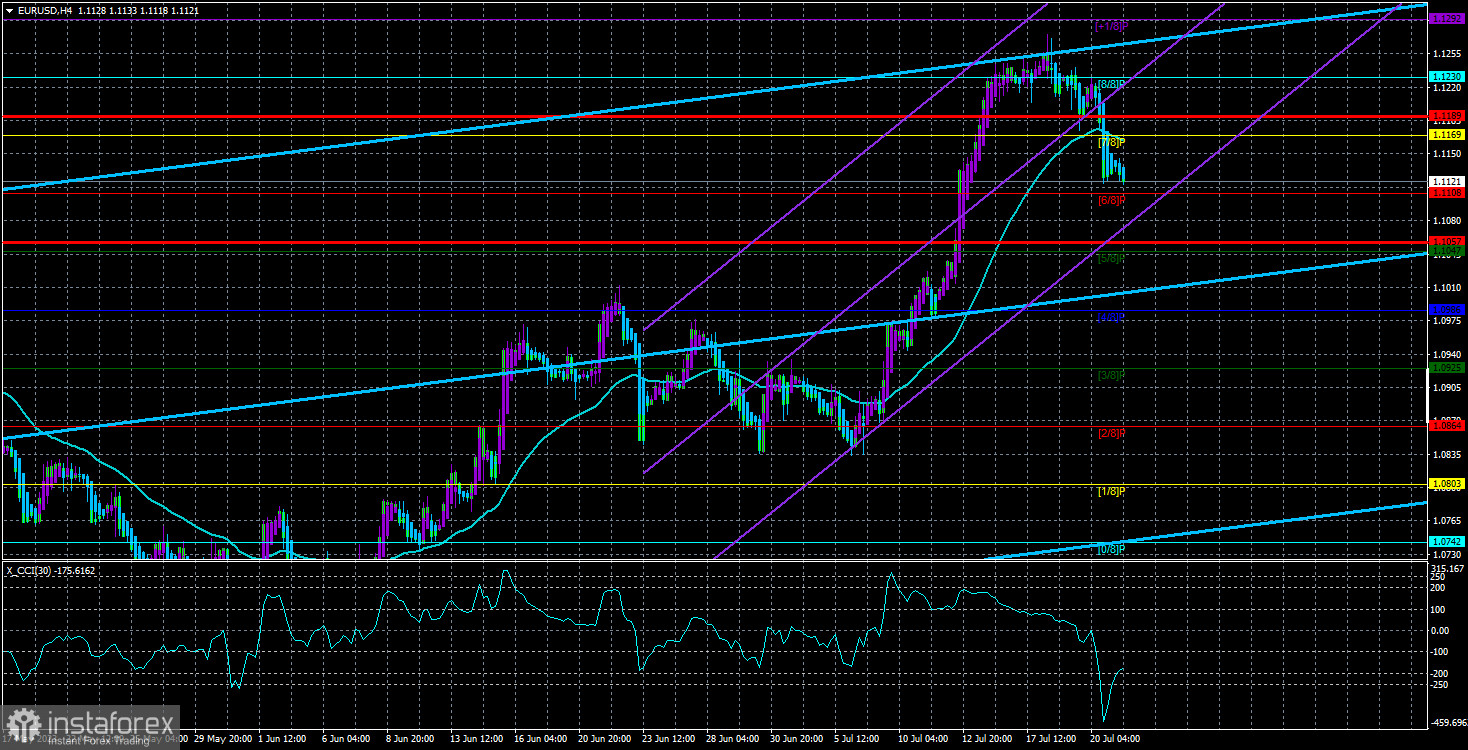
The EUR/USD currency pair experienced a decline on Thursday and part of Friday, making it quite challenging to describe the recent drop in quotes. On the one hand, the euro has been extremely overbought, rising for ten months with only rare and weak corrections. One might wonder what else is needed for a correction to begin. Additionally, over the past two weeks (before the current one), the European currency strengthened significantly, practically without any fundamental basis, which is also a significant reason for a correction. On the other hand, there were no apparent signs of trouble for the euro yesterday. The fundamental background was absent, and the only notable macroeconomic events were two secondary reports from the United States, one in the "red" zone and the other in the "green." However, neither of these reports could provoke the kind of movement we sometimes see after central bank meetings.
Considering only the technical aspects and applying sound logic, it becomes evident that the drop in the euro is not only logical but also likely to continue. Even when considering the market sentiment over the past few months, or even a year, and the dubious factors that drove the pair to such heights, the upward trend appears to resume at any time.
As before, we recommend relying on technical signals. The pair is below the moving average line, making selling the preferred option. In the early days of the next week, we may witness an upward retracement as the CCI indicator enters the oversold territory, providing a strong signal for an upward movement. However, this does not necessarily mean the upward trend will resume, but an upward retracement is anticipated.
On the 24-hour timeframe, there are no signs of the upward trend ending yet. The price has yet to reach the critical Kijun-sen line. It may also undergo a correction towards the Senkou Span B line and then calmly resume the upward trend. The dollar's position remains highly volatile.
Regarding the upcoming central bank meetings, no surprises are expected from both the Fed and the ECB. The probability of raising rates by 0.25% is almost 100%. However, significant movements are possible before and after the meetings. The market is still determining the announcements from the heads of the ECB and the Fed. Jerome Powell may explicitly state that the monetary policy tightening cycle is complete (even if it is hard to believe). Still, regardless of his statements, the market will keep this moment in mind. The more "dovish" Powell's speech is, the higher the chances of the dollar declining again.
The ECB's situation is somewhat different. While it is evident that the key rate should continue to rise, the market needs to know how many more tightening steps are planned. Some ECB's monetary committee members have openly stated that rate hikes in the autumn are not guaranteed. While they may be in the minority during the voting, the ECB historically raises rates slower and weaker than the Fed or the Bank of England. If the market senses that the European regulator is preparing to end its cycle, the euro might come under pressure.
In general, predicting where the pair will be in a week is impossible. Considering the overall situation, the euro is expected to fall. However, the market has shown a strong demand for the euro for several months, and this trend may continue. Thus, we are closely monitoring not only fundamentals and macroeconomics (which are often ignored) but also technical indicators and signals.

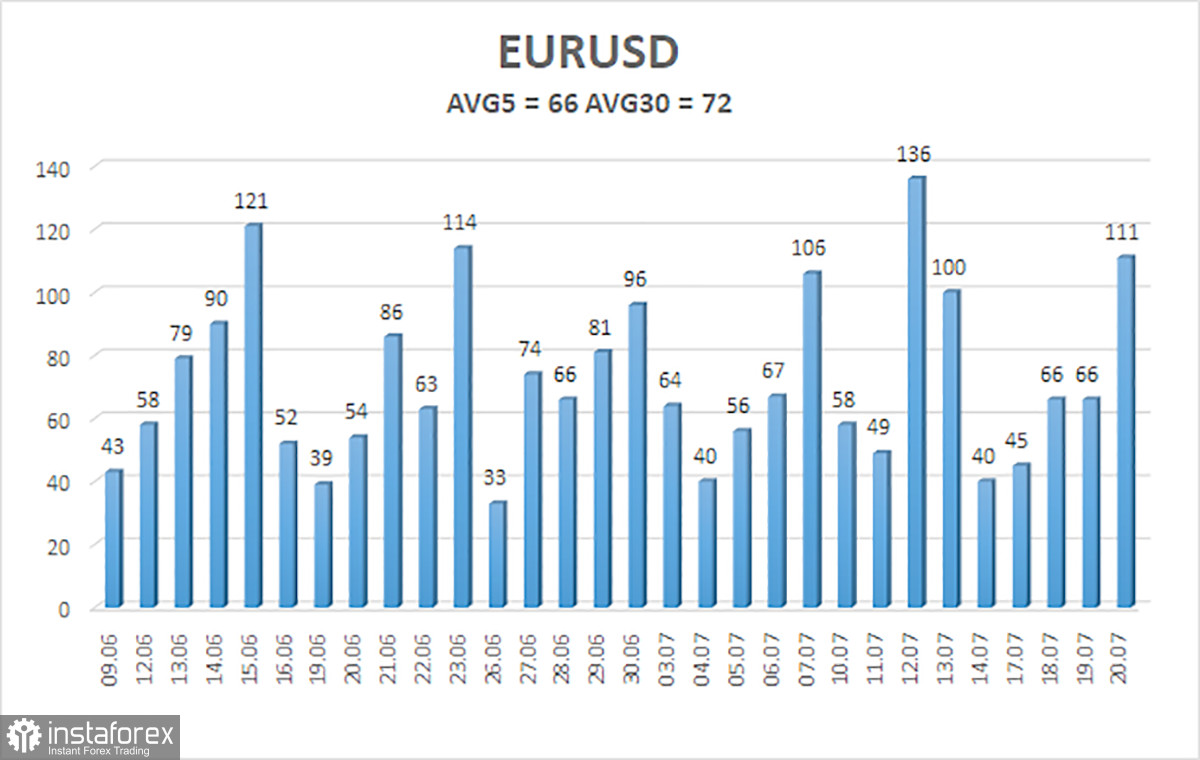
As of July 21, the average volatility of the euro/dollar currency pair over the last five trading days is 66 pips, categorized as "average." Therefore, on Friday, we expect the pair to move between the levels of 1.1057 and 1.1189. An upward reversal of the Heiken Ashi indicator will indicate the start of a new upward correction.
Nearest support levels:
S1 - 1.1108
S2 - 1.1047
S3 - 1.0986
Nearest resistance levels:
R1 - 1.1169
R2 - 1.1230
R3 - 1.1292
Trading recommendations:
The EUR/USD pair has started a downward movement, and the question is how long it will continue. Staying in short positions with targets at 1.1108 and 1.1057 is advisable until the Heiken Ashi indicator reverses upward. Long positions will only become relevant after the price is confirmed above the moving average line, with targets at 1.1230 and 1.1292.
Explanations for the illustrations:
Linear regression channels - help determine the current trend. If both point in the same direction, it indicates a strong current trend.
Moving average line (settings 20,0, smoothed) - identifies short-term trends and the current direction for trading.
Murray levels - target levels for movements and corrections.
Volatility levels (red lines) - indicate the probable price channel where the pair may move in the next 24 hours based on current volatility indicators.
CCI indicator - when it enters the oversold area (below -250) or the overbought area (above +250), it signals an upcoming trend reversal in the opposite direction.


