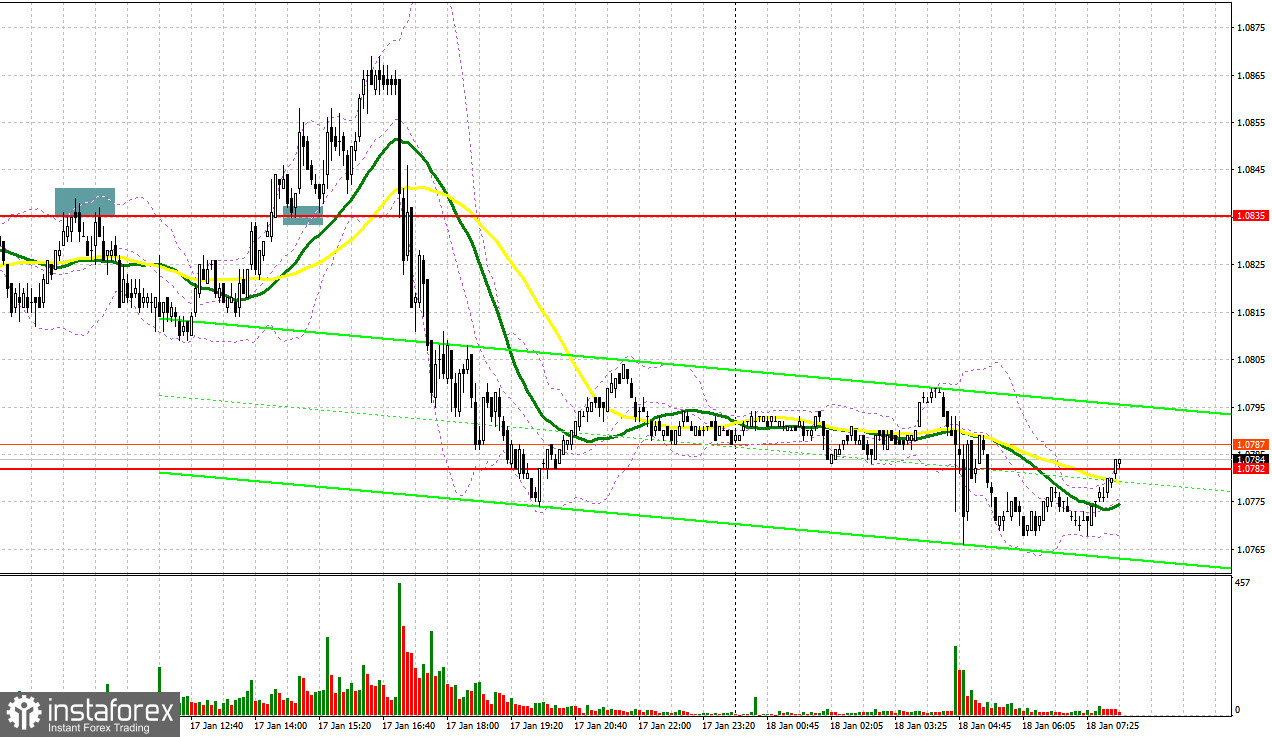
Yesterday, there were several excellent market entry signals. Let's take a look at the M5 chart to get a picture of what happened. Earlier, I highlighted the level of 1.0835 and recommended selling on a false breakout. The euro did not react to a rather impressive fundamental report, which confirmed that bulls are not willing to buy at the moment and at the current highs. A false breakout at 1.0835 gave a sell signal, but after falling 25 pips, the pressure on the trading instrument decreased. During the European session, the bulls broke through the barrier and rose above 1.0835, and the upward test gave a buy signal, which caused EUR to rise by almost 30 pips. I did not see any other entry points to the market.

When to go long on EUR/USD:
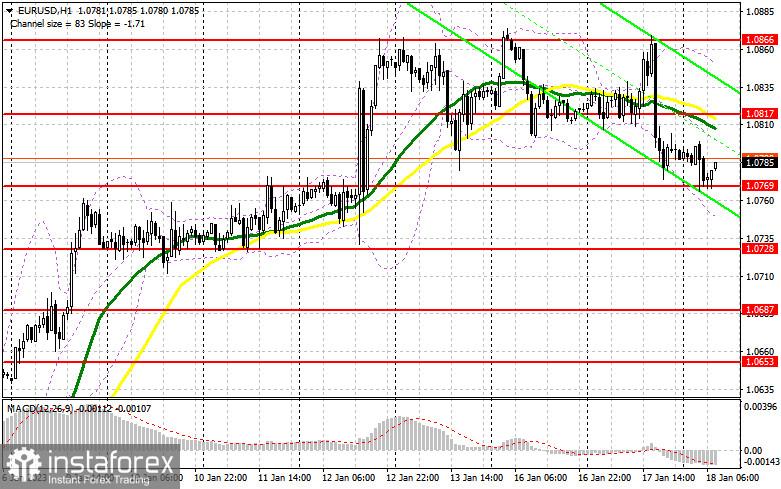
Today is a rather busy day, which will provide an answer to the question regarding the euro's direction. During the European session, traders will assess the eurozone consumer price index, which may fall more than projections, but it is unlikely to help the euro. Just recently one of the European Central Bank officials said that high inflation forces them to continue hiking rates. Therefore, on the one hand, high inflation may help the euro to strengthen today. If traders don't react to this report like what they did yesterday, I advise not to rush with long positions. The speech of Isabelle Schnabel, the ECB's Executive Board member, may also influence the pair's direction, albeit indirectly. For this reason, it would be good to be certain that there are bulls around the nearest support at 1.0769 to build up long positions.
In case the EUR/USD falls there, a false breakout through the barrier will make a buy signal with the target at the 1.0817. As moving averages benefiting bears are in this area. A breakout and a test can take place if we receive strong eurozone data. It will create an additional buy signal with the prospect of a pullback to 1.08940, which will stimulate the formation of a bullish trend. A breakout of this level will also force bears to Stop Loss orders and give an additional buy signal. The pair could advance to 1.0931 where I recommended locking in profits. If EUR/USD goes down and there is a lack of bullish activity at 1.0769, the pair will face pressure. Therefore, a buy signal will only be generated after a false breakout through support at 1.0728. If EUR/USD goes down and there is a lack of bullish activity at 1.0782, the pair will face tremendous pressure although the bulls are likely to remain in control of the market. Therefore, a buy signal will only be generated after a false breakout through support at 1.0735. It will also become possible to go long on a rebound from the low of 1.0687 or 1.0653, allowing a bullish correction of 30 to 35 pips intraday.
When to go short on EUR/USD:
Yesterday, bears did their best to hold back the bullish trend and today they are counting on a breakdown of the intermediate support at 1.0769, formed during the Asian session. Considering today's reports, the bears have a lot to look forward to. In case EUR/USD jumps during the European session, the time to sell will be a false breakout above 1.0817, which will be a sell signal against the trend and a fall to 1.0769. Bulls and bears are unlikely to tussle for this level because there might be no one below this range. A breakout and a retest to 1.0769 might do harm to the bullish prospects, adding pressure on the euro and creating another sell signal towards 1.0728. A consolidation below this range will also cause a larger drop to the area of 1.0687. The next target will be 1.0653. A test of this level will indicate the formation of a bear market. I recommend locking in profits there. If EUR/USD goes up in the course of the European session and there is a lack of bullish activity at 1.0817, go short after a false breakout through 1.0866. EUR/USD could be sold on a rebound from 1.0931, allowing a bearish correction of 30 to 35 pips intraday.

COT report:
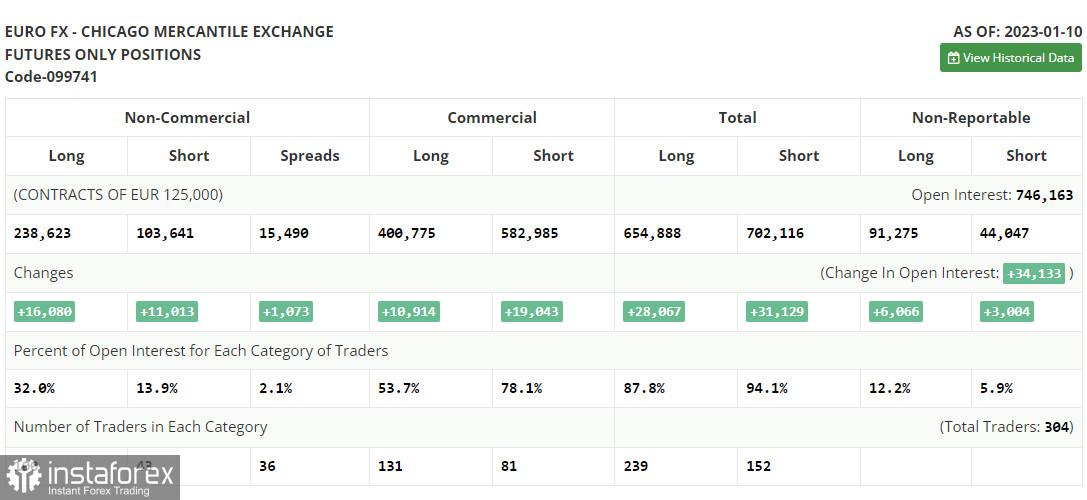
The COT report for January 10 illustrates a steep rise in long and short positions. Trading activity is clearly on the rise after the winter holiday season and the release of US inflation statistics for December. A fall in inflation allows the Federal Reserve to reduce the pace of rate hikes at the February meeting. If the central bank announces a 0.25% rate increase, this will inevitably lead to a weaker dollar against the euro. Demand for risk assets is also growing. Indeed, a less hawkish stance of the US central bank brings back risk appetite, which decreased significantly last year. According to the latest COT report, long non-commercial positions grew by 16,080 to 238,623 and short non-commercial positions rose by 11,013 to 103,641. Consequently, the non-commercial net position came in at 134,982 versus 129,915 a week ago. Investors are now betting on the euro on expectations of a less aggressive stance of world central banks this year. Still, for a surge in price, new fundamental factors are needed. The weekly closing price ascended to 1.0787 versus 1.0617.

Indicator signals:
Moving averages
Trading is carried out below the 30-day and 50-day moving averages. It indicates that the bears are trying to seize the initiative.
Note: The period and prices of moving averages are viewed by the author on the hourly chart and differ from the general definition of classic daily moving averages on the daily chart.
Bollinger Bands
Resistance is seen at 1.0855, in line with the upper band. Support stands at 1.0750, in line with the lower band.
Indicator description:
- Moving average (MA) determines the current trend by smoothing volatility and noise. Period 50. Colored yellow on the chart.
- Moving average (MA) determines the current trend by smoothing volatility and noise. Period 30. Colored green on the chart.
- Moving Average Convergence/Divergence (MACD). Fast EMA 12. Slow EMA 26. SMA 9.
- Bollinger Bands. Period 20
- Non-commercial traders are speculators such as individual traders, hedge funds, and large institutions who use the futures market for speculative purposes and meet certain requirements.
- Long non-commercial positions are the total long position of non-commercial traders.
- Non-commercial short positions are the total short position of non-commercial traders.
- Total non-commercial net position is the difference between the short and long positions of non-commercial traders.


