You require the following to open long positions on the GBP/USD:
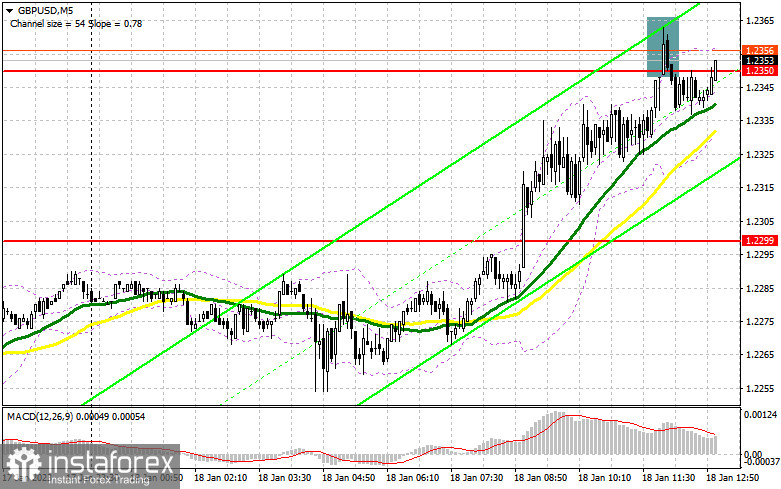
Only one indication to enter the market was produced in the morning. Let's analyze the 5-minute chart to see what transpired there. We were able to obtain a strong sell signal thanks to the development and construction of a false breakdown in the vicinity of 1.2350, which is still active as of this writing. It didn't reach a significant downward movement, and it's possible that it won't either. I made only minor changes to the technical image in the afternoon.

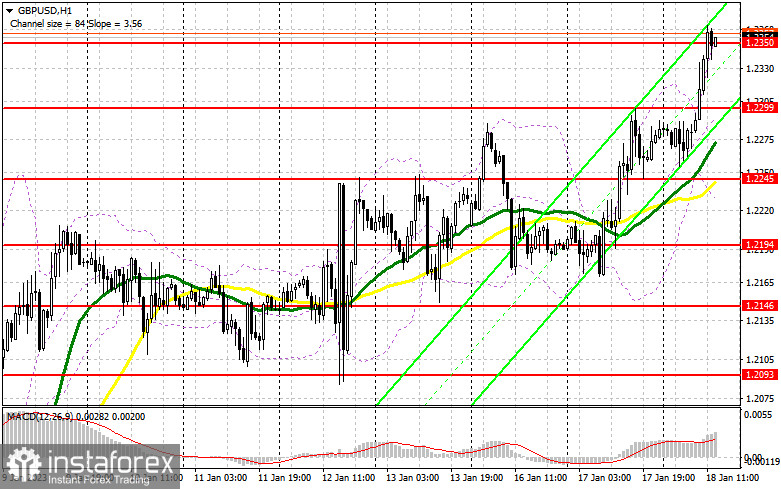
The continuation of the UK's high level of inflation prompted more pound buying. Although the report was in line with expectations, with only a modest decline in the indicator, the Bank of England will undoubtedly have to raise interest rates if inflation exceeds the target number by a factor of more than five, which is a strong reason to buy the pound in the near term. According to data released today, the retail trade volume in the United States is changing. Growth in the index will undoubtedly increase expectations that inflation will be high for an extended period. This means that the Federal Reserve System will continue to pursue an aggressive policy, which will weaken the position of the pound and encourage purchases of the US dollar. In the given circumstances, a decrease in the pound to a level of around 1.2299, where a reverse test was conducted from top to bottom in the first half of the day, would be the best scenario for buying. An ideal entry point with the goal of re-breaking and breaking 1.2350 would be provided by a false breakout at this level. If this range is broken with a top-down test, there is a chance that the bullish rally will continue with the 1.2399 update, which is where I will take profits. The 1.2443 area will be a further aim, but it will be possible to reach it if retail sales in the United States see a significant decline. If the bulls are unable to complete the tasks at hand and miss 1.2299, I anticipate the emergence of a stronger downward correction with a test of the support level of 1.2245, where the moving averages are working in the bulls' favor. I will only open long positions there if there is a false breakdown. I'll think about purchasing GBP/USD right away in anticipation of a recovery from 1.2194 to gain 30-35 points in a single day.
You require the following to open short trades on the GBP/USD:
The sole hope for selling is the closest resistance level of 1.2350. Having missed it, the bullish tendency will undoubtedly continue to develop. As a result, I only view one more development of a false breakdown in the vicinity of 1.2350 as the ideal selling scenario. This might occur following the disclosure of US statistics and the statements made by James Bullard and Rafael Bostic, two FOMC members. In this instance, the support level of 1.2299, which serves as resistance in the morning hours, will be the objective of the bears. A breakout and reversal test from the bottom up of this range will put more pressure on the pound and provide an entry opportunity to sell with a rise to 1.2245 and the potential of updating 1.2194, where I will fix the profit. At a distance, an area of 1.2146 will be the goal. Buyers of the pound will feel its strength again with the possibility of GBP/USD growth and the absence of bears around 1.2350, and everything is moving in this direction. This might result in an update to the monthly maximum. In this instance, the only entry point into short positions with an eye toward a new downward movement is a false breakout in the vicinity of the next resistance level at 1.2399. If there isn't any activity there, I'll sell GBP/USD right away at its highest price of 1.2443, but only if I believe the pair will decline another 30-35 points during the day.


Signals from indicators
Moving Averages
The fact that trading is taking place above the 30- and 50-day moving averages shows that the market is optimistic.
Notably, the author considers the time and prices of moving averages on the hourly chart H1 and departs from the standard definition of the traditional daily moving averages on the daily chart D1.
Bands by Bollinger
The indicator's lower limit, which is located at 1.2245, will serve as support in the event of a downturn.
Description of indicators
- Moving average (moving average determines the current trend by smoothing out volatility and noise). Period 50. The graph is marked in yellow.
- Moving average (moving average determines the current trend by smoothing out volatility and noise). Period 30. The graph is marked in green.
- MACD indicator (Moving Average Convergence / Divergence - moving average convergence/divergence) Fast EMA period 12. Slow EMA period 26. SMA period 9
- Bollinger Bands (Bollinger Bands). Period 20
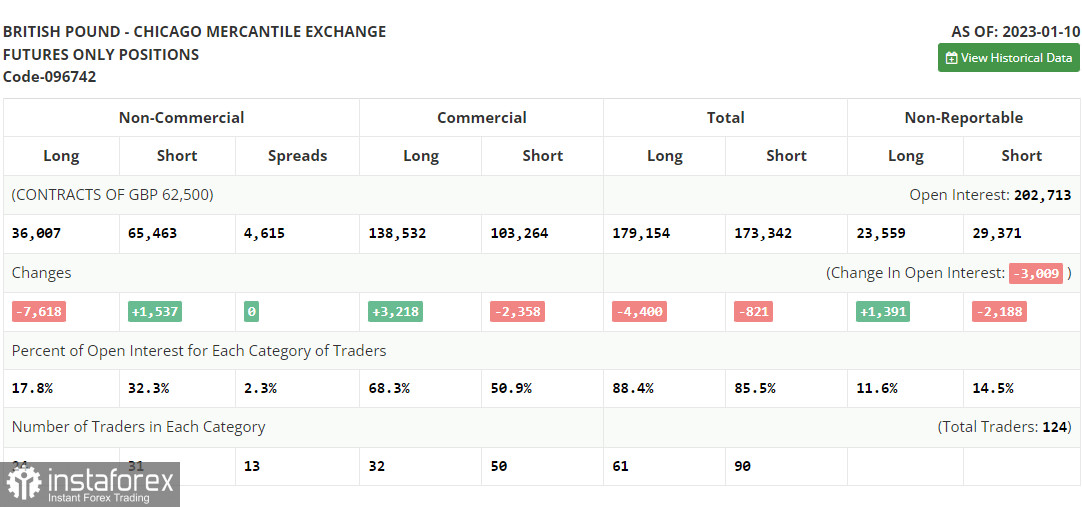
- Non-profit speculative traders, such as individual traders, hedge funds, and large institutions, use the futures market for speculative purposes and to meet certain requirements.
- Long non-commercial positions represent the total long open position of non-commercial traders.
- Short non-commercial positions represent the total short open position of non-commercial traders.
- Total non-commercial net position is the difference between the short and long positions of non-commercial traders.


