


Analyzing Monday's trades:
EUR/USD on 30M chart
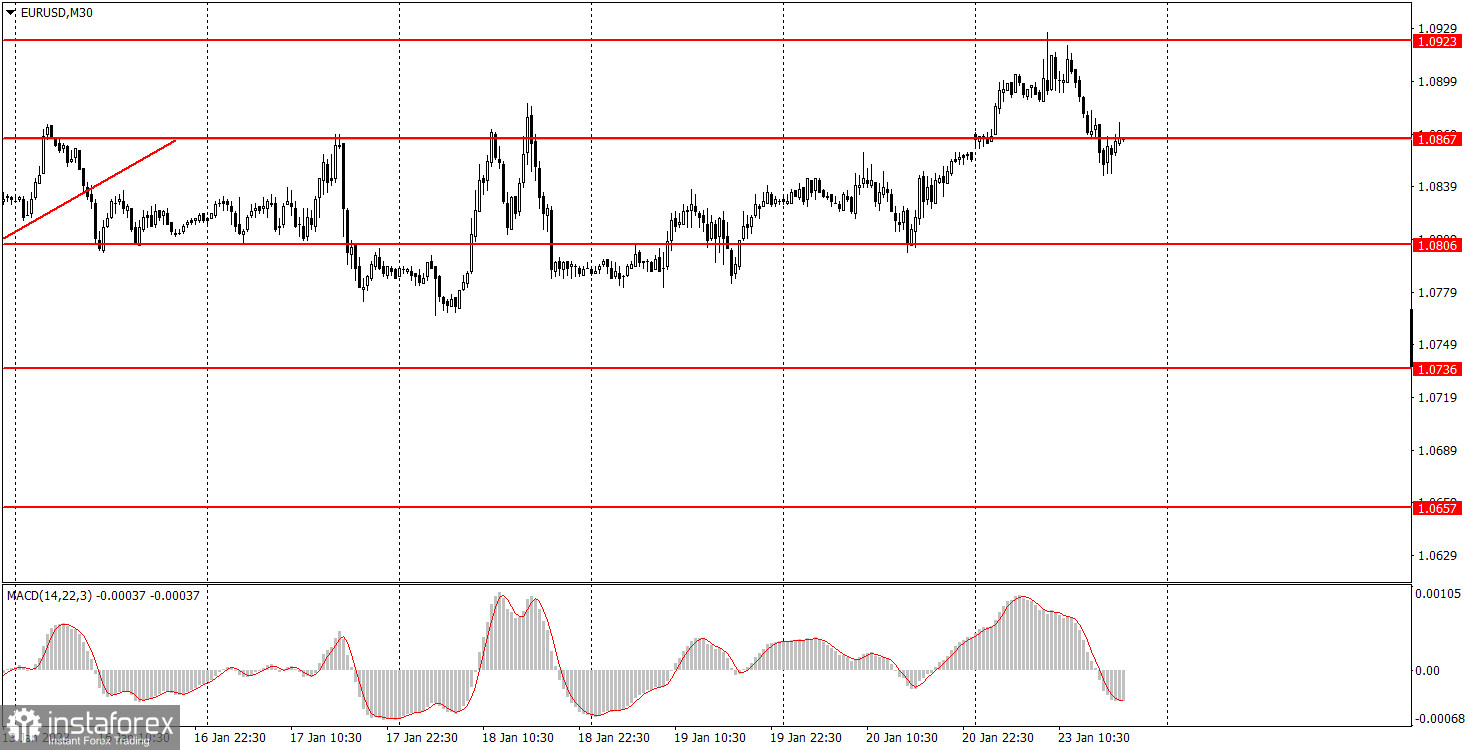
EUR/USD, without swinging for a long time, immediately resumed the upward movement. Recall that the pair moved mainly sideways last week. But today we can say that the movement was double-edged, since the price was already declining during the US session. And there were no fundamental and macroeconomic reasons for such movements. There were no interesting events during the day, except for the speech of European Central Bank President Christine Lagarde. But it couldn't affect the earlier trades, so Monday was a classic day of purely technical moves. As you can see, just because the fundamentals and macroeconomics aren't there doesn't mean the price is standing in one place. Although, the previous week was flat and the ascending trendline was broken earlier, at the moment, the pair keeps the uptrend. I've already mentioned many times that during the last months, the market often buys EUR when there are no reasons for that. A bearish correction has been brewing for a long time, but it still cannot start.
EUR/USD on M5 chart
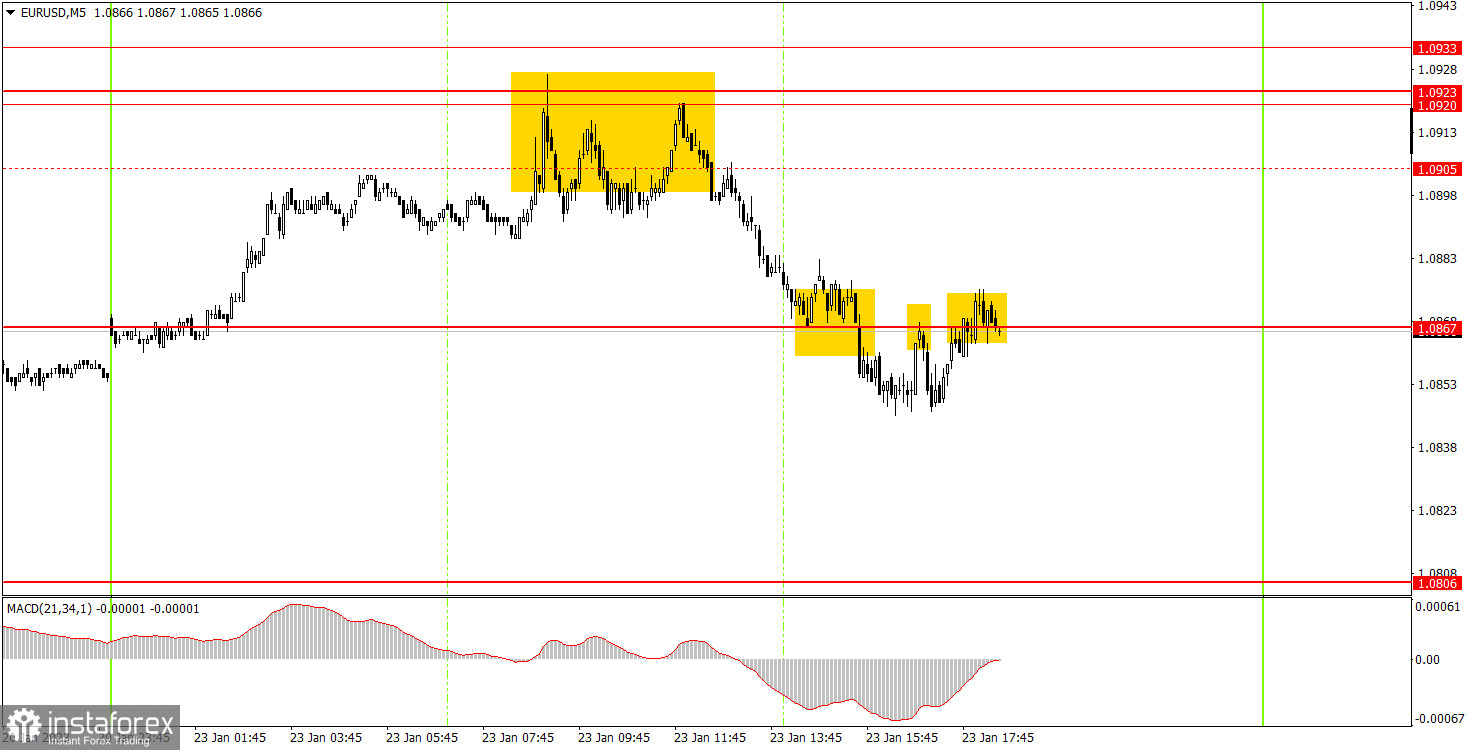
Several interesting signals were formed, but the pair was not moving in the best way. In the European trading session, the pair bounced from the 1.0905-1.0923 area three times, though there were actually more levels located nearby. The downward movement did begin on the third time, and the price dropped below the nearest level of 1.0867. Beginners had to use these signals through a short position, and it had to be closed manually closer to the evening, since there was no buy signal during the day. It was possible to get a profit of about 30 points on this deal.
Trading tips on Tuesday:
The pair maintains the uptrend on the 30-minute chart, despite crossing the trend line. The flat seems to be over, and now the pair can continue its groundless growth again. It does not even need a clear justification for that, it's just the reality on the currency market now. The market is repelled by the fact that the Federal Reserve is likely to slow down the rate hike again in February, and that fact is enough to sell the dollar. On the 5-minute chart, it is recommended to trade at the levels 1.0657-1.0668, 1.0697, 1.0736, 1.0768, 1.0806, 1.0920-1.0923-1.0933, 1.0966, 1.0989. Lagarde will speak in the EU and there's nothing in the US. I believe that Lagarde's new speech will be no better than the old ones, so I don't expect a strong reaction. The flat is likely to continue.
Basic rules of the trading system:
1) The strength of the signal is determined by the time it took the signal to form (a rebound or a breakout of the level). The quicker it is formed, the stronger the signal is.
2) If two or more positions were opened near a certain level based on a false signal (which did not trigger a Take Profit or test the nearest target level), then all subsequent signals at this level should be ignored.
3) When trading flat, a pair can form multiple false signals or not form them at all. In any case, it is better to stop trading at the first sign of a flat movement.
4) Trades should be opened in the period between the start of the European session and the middle of the US trading hours when all positions must be closed manually.
5) You can trade using signals from the MACD indicator on the 30-minute time frame only amid strong volatility and a clear trend that should be confirmed by a trendline or a trend channel.
6) If two levels are located too close to each other (from 5 to 15 pips), they should be considered support and resistance levels.
On the chart:
Support and Resistance levels are the levels that serve as targets when buying or selling the pair. You can place Take Profit near these levels.
Red lines are channels or trend lines that display the current trend and show in which direction it is better to trade now.
The MACD indicator (14, 22, and 3) consists of a histogram and a signal line. When they cross, this is a signal to enter the market. It is recommended to use this indicator in combination with trend patterns (channels and trendlines).
Important announcements and economic reports that can be found on the economic calendar can seriously influence the trajectory of a currency pair. Therefore, at the time of their release, we recommend trading as carefully as possible or exiting the market in order to avoid sharp price fluctuations.
Beginners on Forex should remember that not every single trade has to be profitable. The development of a clear strategy and money management is the key to success in trading over a long period of time.


