


Analyzing Monday's trades:
GBP/USD on 30M chart
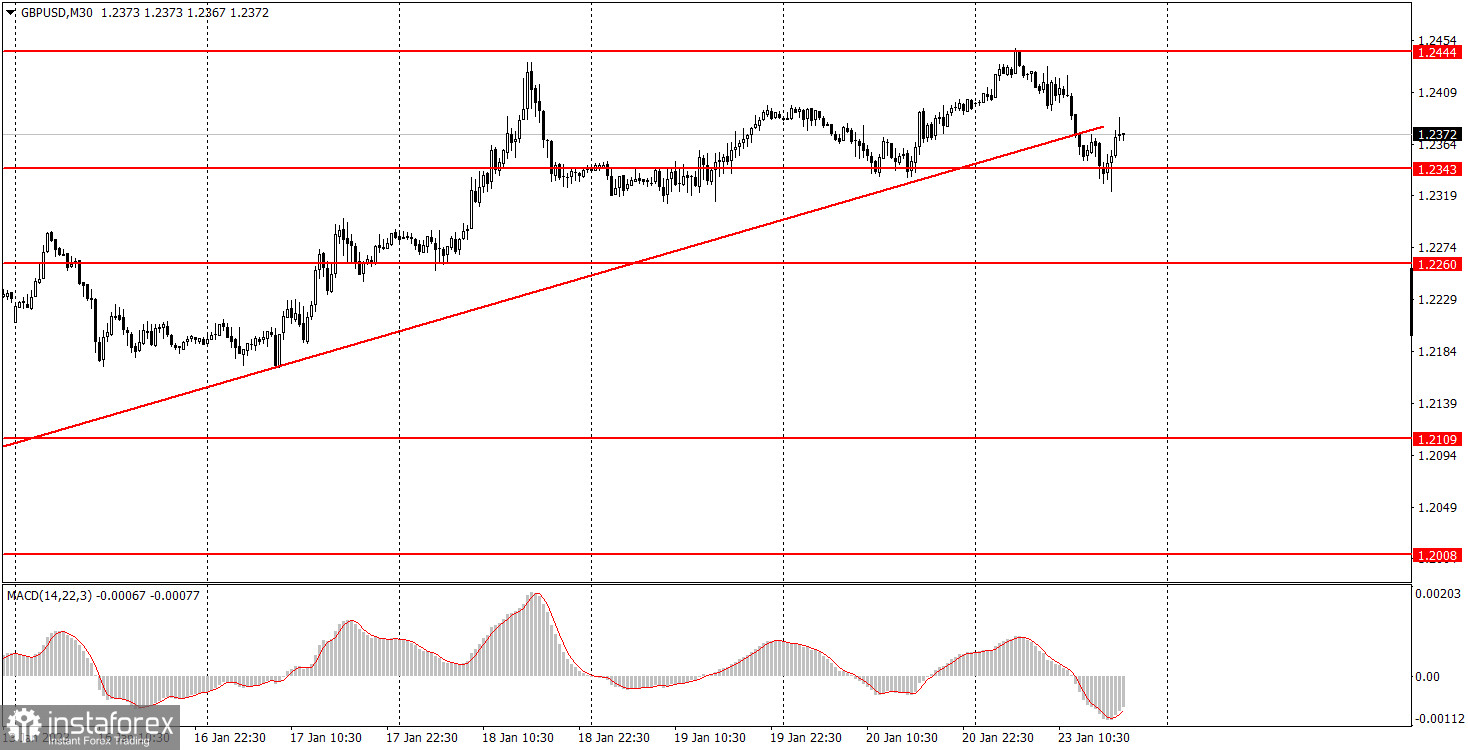
On Monday, GBP/USD started the day with growth and finished it with the fall. The fall was not a strong one, but it led to consolidation below the ascending trend line, which formally allows us to expect the fall of the British currency now. Unfortunately, crossing the trend line in the current circumstances means almost nothing. We have already seen these things happen during the last weeks, after which both of the major pairs quietly resumed their upward movement. Of course, this time it might be different, but the price did not even settle below the nearest level of 1.2343. So far, the nearest thing that we've seen to a correction was "as much as" 120 pips. There were no important reports or events in the UK or the US. Therefore, the movements were exclusively technical. The meetings of the Bank of England and Federal Reserve will happen soon, so the market sentiment may change slowly, assuming that the main factor in reducing the divergence between rates has already been worked out by the market. But this is only a fundamental hypothesis.
GBP/USD on M5 chart
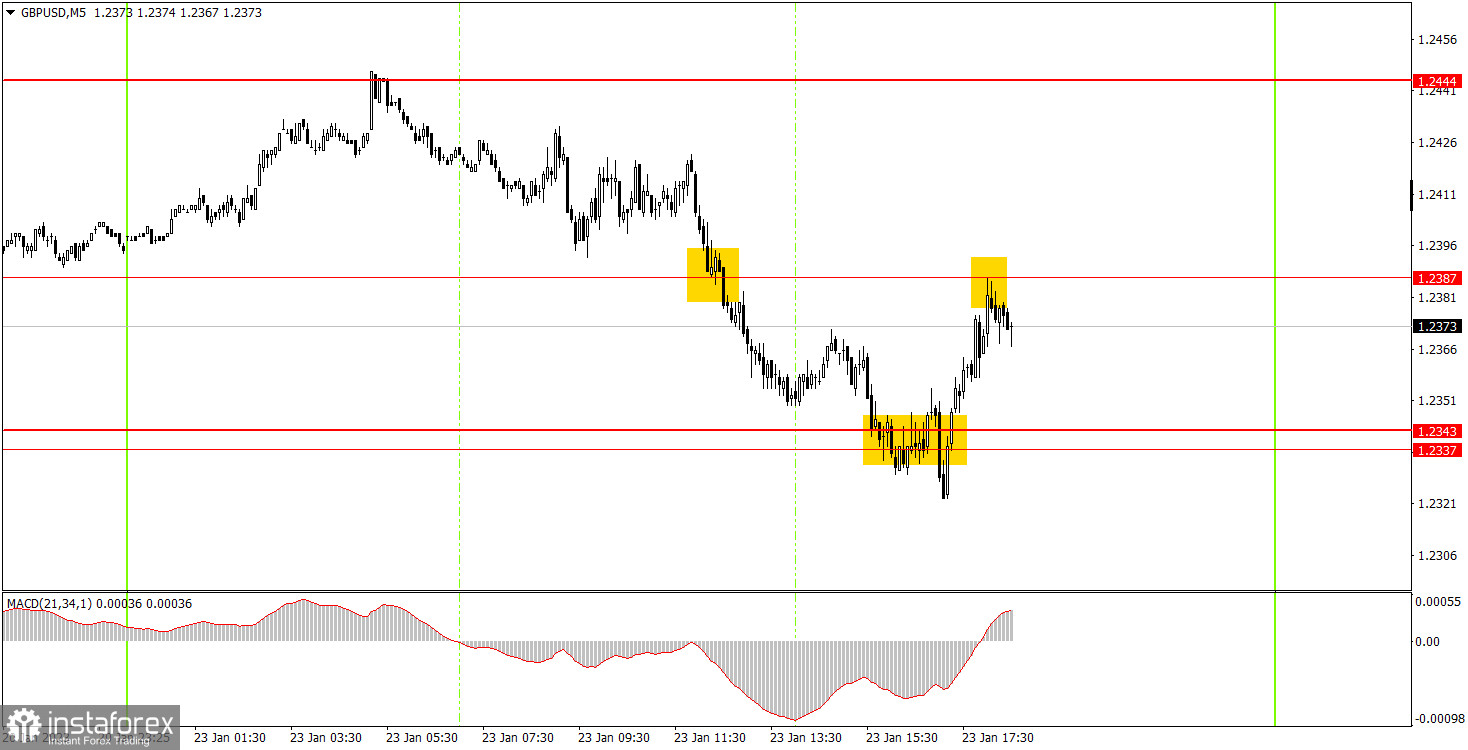
The pair was moving down for most of the day, but unfortunately we failed to catch the very beginning of this movement. A sell signal was formed near 1.2444 during the Asian session, and then the next one was near 1.2387. It was the time when novice traders could open short positions. The pound continued to fall, but after the price settled above 1.2343, shorts should have been closed. The profit was about 20 pips. The buy signal around this level could also be used, and before the evening, the pair went back to 1.2387, where you should have closed the long position with about 20 pips more profit. It was not such a bad day.
Trading tips on Tuesday:
GBP/USD maintains an uptrend on the 30-minute chart, although it has crossed the trend line. Nevertheless, before the price settles below 1.2343, I wouldn't expect a sharp fall from the pair. In case it overcomes this level, the pound will have a chance to form a noticeable correction. On the 5-minute chart, it is recommended to trade at the levels 1.2109, 1.2171-1.2179, 1.2245-1.2260, 1.2337-1.2343, 1.2387, 1.2444-1.2471, 1.2577-1.2597. As soon as the price passes 20 pips in the right direction, you should set a Stop Loss to breakeven. On Tuesday, business activity indexes in the services and manufacturing sectors are scheduled for release in the UK and the US. Not the most important data, considering that all 6 indices are now below the key level of 50.0. We should only expect a market reaction in case results significantly deviate from the expected values.
Basic rules of the trading system:
1) The strength of the signal is determined by the time it took the signal to form (a rebound or a breakout of the level). The quicker it is formed, the stronger the signal is.
2) If two or more positions were opened near a certain level based on a false signal (which did not trigger a Take Profit or test the nearest target level), then all subsequent signals at this level should be ignored.
3) When trading flat, a pair can form multiple false signals or not form them at all. In any case, it is better to stop trading at the first sign of a flat movement.
4) Trades should be opened in the period between the start of the European session and the middle of the US trading hours when all positions must be closed manually.
5) You can trade using signals from the MACD indicator on the 30-minute time frame only amid strong volatility and a clear trend that should be confirmed by a trendline or a trend channel.
6) If two levels are located too close to each other (from 5 to 15 pips), they should be considered support and resistance levels.
On the chart:
Support and Resistance levels are the levels that serve as targets when buying or selling the pair. You can place Take Profit near these levels.
Red lines are channels or trend lines that display the current trend and show in which direction it is better to trade now.
The MACD indicator (14, 22, and 3) consists of a histogram and a signal line. When they cross, this is a signal to enter the market. It is recommended to use this indicator in combination with trend patterns (channels and trendlines).
Important announcements and economic reports that can be found on the economic calendar can seriously influence the trajectory of a currency pair. Therefore, at the time of their release, we recommend trading as carefully as possible or exiting the market in order to avoid sharp price fluctuations.
Beginners on Forex should remember that not every single trade has to be profitable. The development of a clear strategy and money management is the key to success in trading over a long period of time.


